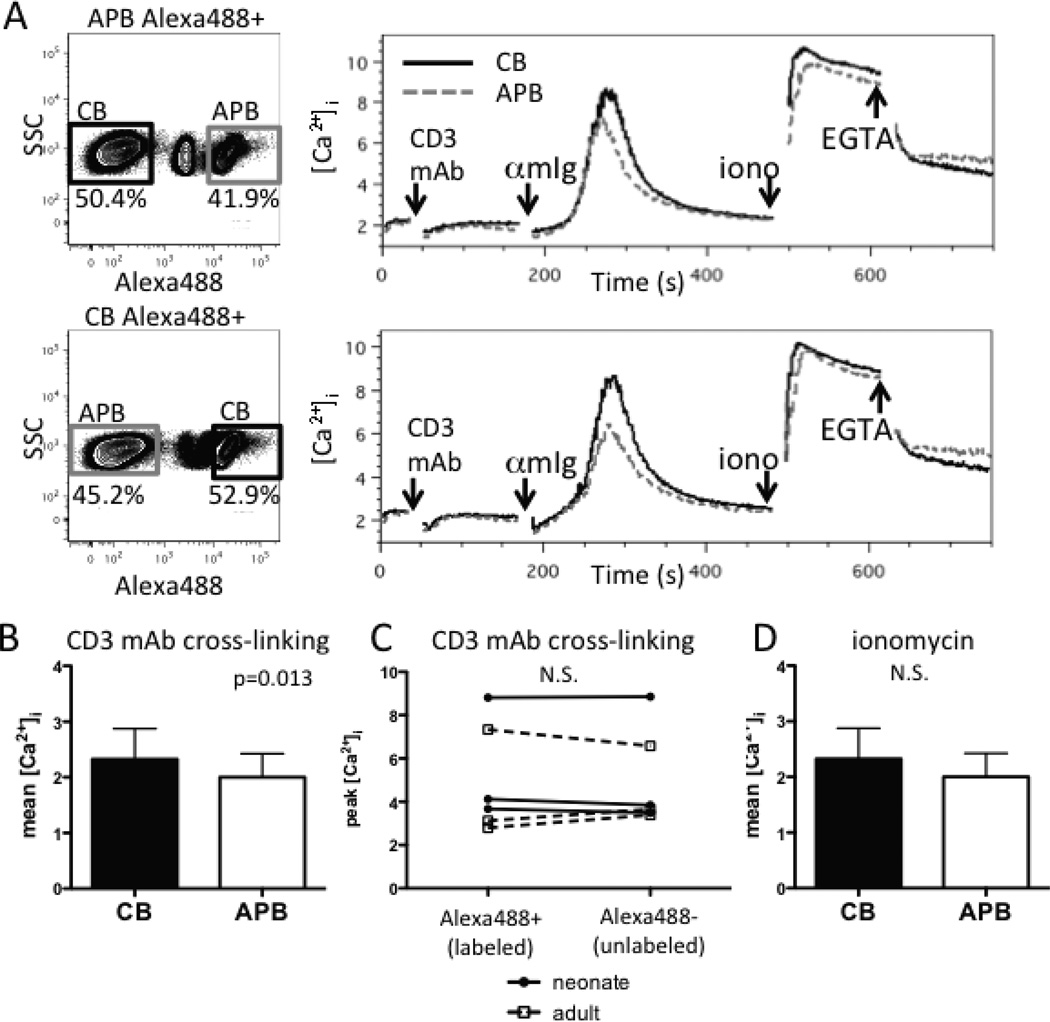
FIGURE 1.
Naive CD4+ T cells of CB have a higher calcium flux than APB naive CD4+ T cells after CD3 mAb cross-linking using anti-mouse IgG (αmIg). (A) Representative flow cytometry plots of Alexa488 labeled and unlabeled naive CD4+ T-cell cell populations (left panels) and their median indo-1 ratio of Alexa488 labeled CB (solid black line) and unlabeled APB (dashed gray line) naive CD4+ T cells (right top panel) versus unlabeled CB and Alexa488 labeled APB CD4+ T cells (right bottom panel). (B) Mean [Ca2+]i after CD3 mAb cross-linking is significantly higher in CB naive CD4+ T cells compared to those of APB (n=3). (C) Alexa488 cell labeling does not have a significant effect on a peak calcium flux of a cell population (n=6). Individual donors are connected by lines. (D) Mean [Ca2+]i following ionomycin addition in CB and APB naive CD4+ T cells (n=3). p-values were calculated using a paired, two-way ANOVA to account for both labeling and sample source. All samples were gated on live, CD8− CD19− CD45RO− MACS-purified naive CD4+ T cells.

