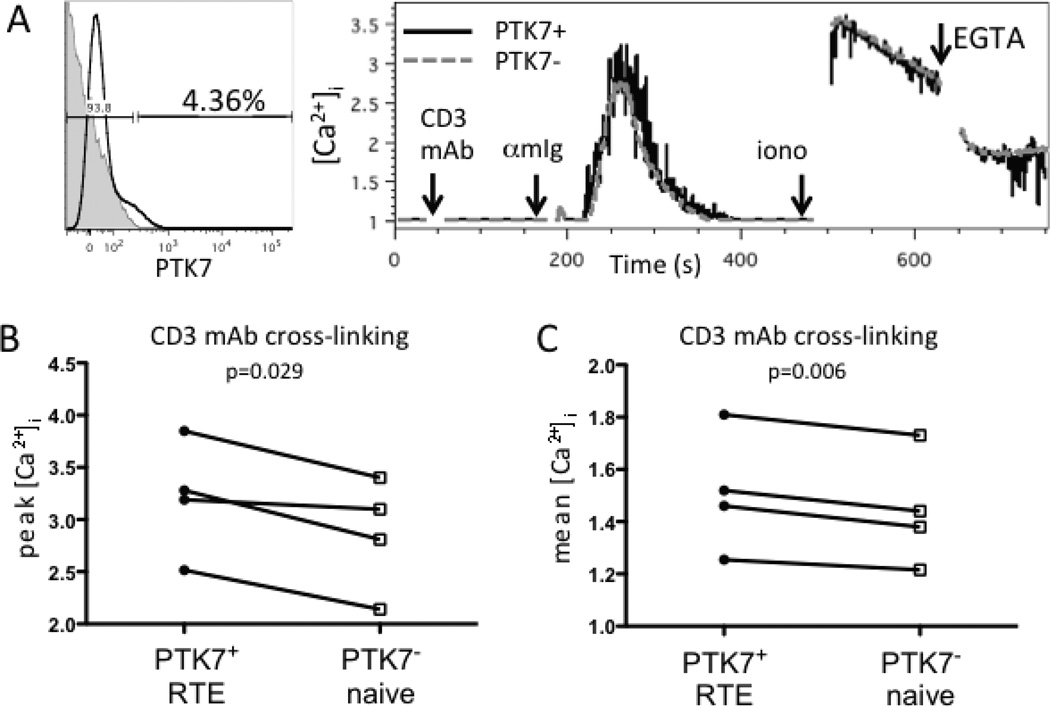
FIGURE 2.
CD4+ PTK7+ RTEs of APB have higher calcium flux after CD3 mAb cross-linking than more mature naive CD4+ T cells. (A) Representative flow cytometry plot of PTK7 staining (black line) overlaid on an isotype control stain (filled gray histogram), and kinetics plot of calcium flux after CD3 mAb crosslinking, ionomycin addition, and EGTA addition in samples from an individual adult donor. (B) Peak [Ca2+]i and (C) mean [Ca2+]i of PTK7+ naive CD4+ T cells (RTE) and PTK7− naive CD4+ T cells after CD3 mAb cross-linking (n=4). PTK7+ and PTK7− cell populations from the same individual are connected by lines. p-values were calculated using a two-tailed, paired student’s t-test. All samples were gated on live, CD8− CD19− CD45RO− purified naive CD4+ T cells.

