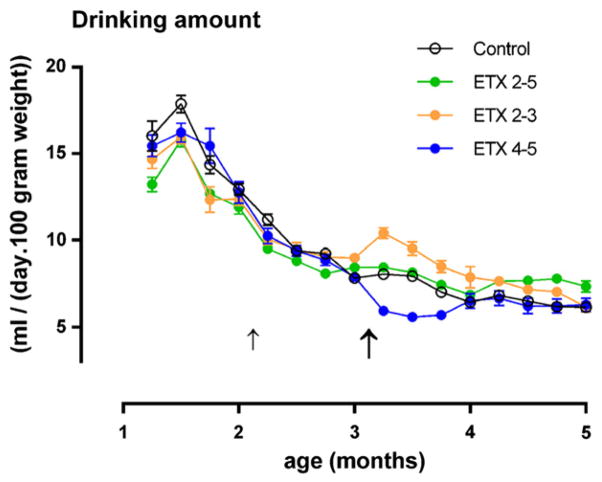
Fig. 2.
Drinking amount in ml per 100 gram body weight per day for each of the four treatments during 18 weeks (from week 5 PN (month 1) to week 22 (month 5) for the four groups (n = 20) in Experiment I. The bold arrow indicates the end of the treatment with ethosuximide of the ETX 2–3 group and the start of the ETX 4–5 group. The shift in treatment at week 9 for the ETX 2–3 month and ETX 4–5 month groups was accompanied by a respective increase and decrease in the amount of water consumption. Means and SEMs are shown.

