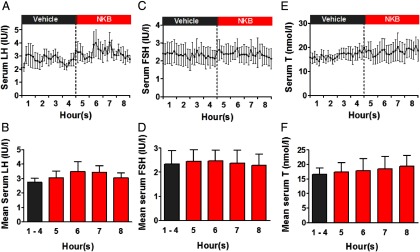
Figure 2.

Frequent blood sampling during a 4-hour iv infusion of vehicle followed by 4 hours of NKB (at an initial rate of 5.12 nmol/kg/h) to healthy men (study 2). Subjects underwent 10 minutes of blood sampling for 8 hours (n = 5). A–C, Time profiles are presented for mean LH (A), FSH (B), and T (C). The vertical dotted line denotes the transition from vehicle to NKB administration. D–F, Mean levels of LH (D), FSH (E), and T (F) are pooled into discrete time bins. Hours 1–4 are coincident with the vehicle administration. Hours 5, 6, 7, and 8 are coincident with the NKB administration. Data are shown as mean ± SEM.
