Abstract
Introduction
Acne vulgaris is the most frequently diagnosed dermatosis in patients aged between 11 and 30. It is believed that it affects about 80% of persons in this age group or even, taking into account lesions of low intensity, 100% of young people. The role of cytokines in the pathogenesis of acne is not fully known. The TLR2 receptors play a role in the aetiology of acne. Stimulation of TLR2 by Propionibacterium acnes makes the IL-8 and IL-12 concentrations increase.
Aim
The aim of this work was to determine IL-1β, IL-1α, IL-8 and TNF-α levels in patients’ sera used to test response to TLR2 stimulation. A decrease in the levels of the above mentioned cytokines together with a decrease in sebum production were defined as an indication of efficient treatment with isotretinoin.
Material and methods
The tests were performed in 155 patients treated for different clinical forms of acne with an oral isotretinoin preparation in the Dermatology Clinic of the Silesian Medical University in Katowice in 2009–2011 – I group and the patients treated with oral isotretinoin 2 and 5 years ago – II group. The control group consisted of 40 healthy individuals.
Conclusions
Measurements of IL-1α, IL-1β and TNF-α sera concentrations could be assessed in parallel to the improvement of the clinical condition and can constitute a good indication of the efficiency of the isotretinoin treatment.
Keywords: acne vulgaris, aetiology, cytokines
Introduction
Acne vulgaris is the most common dermatosis found in the patients aged between 11 and 30. It is believed that acne affects up to 80% of persons from this group, or even 100% of young people, when taking into account its mild forms. The skin changes appearing in the second decade of life, become less intensive with time and usually disappear at the end of this decade, or at the beginning of the third decade of life. However, there are cases when the disease is still present until 30 or even 40 years of age [1, 2].
Ninety-five percent of changes are localised on the face and on the upper part of the trunk, rarely on other body parts and this disease frequently constitutes a serious psychological problem for a patient because of its localisation and chronic character [1, 3].
The microcomedone is a primary change which starts the whole inflammatory cascade. Different factors may induce formation of microcomedones, such as linolenic acid deficiency, excessive secretion of androgens or excess of free lipid acids. Intrafollicular keratinisation of a microcomedone leads to its development into a comedone [2]. It is accompanied by excessive production of tonofilaments, desmosomes and keratins K6 and K16, and together with transglutaminase, it results in development of a keratinised “envelope”. Altogether, this process leads to closure of a follicle opening and it impedes removal of the sebaceous gland contents onto the skin surface [3–5].
Excessive production and accumulation of sebum and closing of the follicle outings promote development of microorganisms. Microcomedones are colonised mainly by an anaerobic bacterium – Propionibacterium acnes [4].
The role of cytokines in the pathogenesis of acne is not fully known. The TLR2 receptors play a role in the aetiology of acne. Stimulation of TLR2 by P. acnes makes the interleukin 8 and 12 (IL-8 and IL-12) concentrations increase. Macrophages surrounding the pilosebaceous unit with TLR2 receptors were histologically described in biopsy material of patients with acne.
Using immunohistochemical methods, the expression of IL-1α and IL-1β has been demonstrated within sebaceous glands.
The severe forms of acne, such as focal, inverted, fulminant or severe papulopustular acne constitute an indication for general treatment with retinoids [6]. However, all types of acne, which do not respond to treatment and constitute a psychological problem for a patient, today also is an indication for treatment [7].
Retinoids modify cell growth and differentiation, possess immunomodulatory and anti-tumour properties, due to their influence upon DNA transcription. It has been shown that they induce apoptosis of sebocytes without any influence upon the epidermal cells. Apoptosis of sebocytes eliminates the stem cells of sebocytes and precursor cells of sebaceous glands. Therefore, the effects of these drugs are long-term or even permanent [8, 9]. Additionally, retinoids influence maturation and exfoliation of keratinocytes, they stimulate angiogenesis and collagen synthesis [10].
Aim
The aim of this work was to determine of IL-1β, IL-1α, IL-8 and tumor necrosis factor α (TNF-α) levels in patients’ sera used to test response to TLR2 stimulation. A decrease in the levels of the above mentioned cytokines together with a decrease in sebum production were defined as an indication of efficient treatment with isotretinoin.
Material and methods
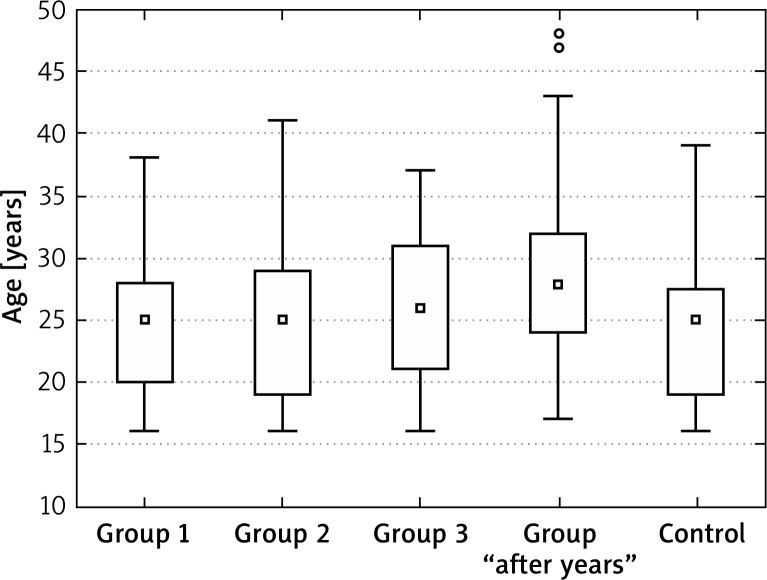
The tests were performed in 155 patients treated for different clinical forms of acne with an oral isotretinoin preparation in the Dermatology Clinic of the Silesian Medical University in Katowice in 2009–2011 – I group and the patients treated with oral isotretinoin 2 and 5 years ago – II group. The control group consisted of 40 healthy individuals (Figure 1).
Figure 1.
Age in tested and control groups
The first group was divided into subgroups: 1 – constant isotretinoin dose of 0.2–0.4 mg/kg bw/day (without dose modification during treatment), 2 – isotretinoin in the dose of > 0.4–1.0 mg/kg bw/day, also without any dose modification during treatment with a 6-month period of observation, 3 – > 0.4–1.0 mg/kg bw/day initially, then the dose was gradually reduced to 0.2–0.4 mg/kg bw/day.
During the enrolment visit (–1), the history of the disease course and previous treatment was collected and a physical examination was performed. Intensity of acne was accessed using the quantitative 5-step “FDA global grade” scale. Changes on the face were accessed with points.
The results of the examination together with the history data were entered into a specially prepared questionnaire. All patients had laboratory tests performed (peripheral blood morphology with smear, triglycerides, total cholesterol, LDL, amylase, bilirubin, asparagine aminotranspherase (AST), alanina aminotranspherase (ALT), γ-glutamylotranspeptidase (GGTP), glucose, alkaline phosphatase).
During the “0” visit, the patients qualified for treatment underwent clinical examination, the preliminary dose was defined (mg/kg of body weight). Women performed a pregnancy test. Blood samples were collected to determine the initial concentrations of IL-1α, IL-1β, IL-8 and TNF-α.
During the “1” visit, the treated patients underwent the same medical procedures as during the “0” visit. The control group was subjected to the examination of IL-1α, IL-1β, IL-8 and TNF-α levels.
Results
Tumour necrosis factor
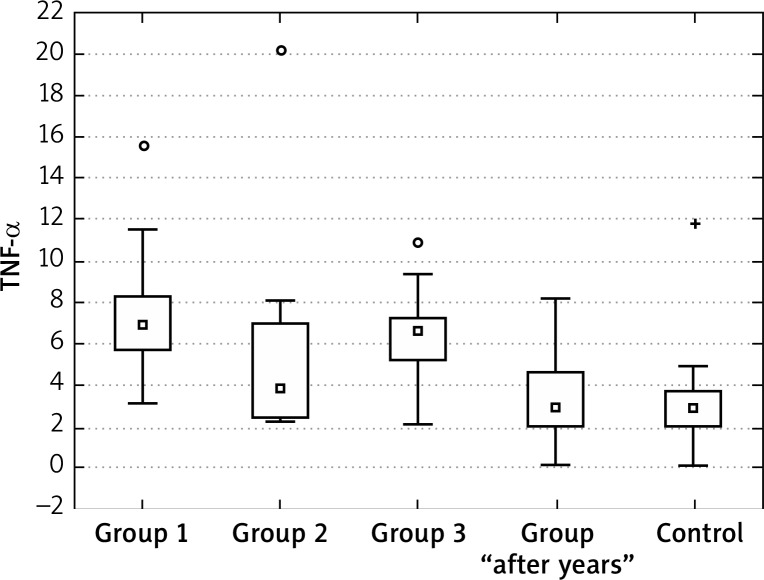
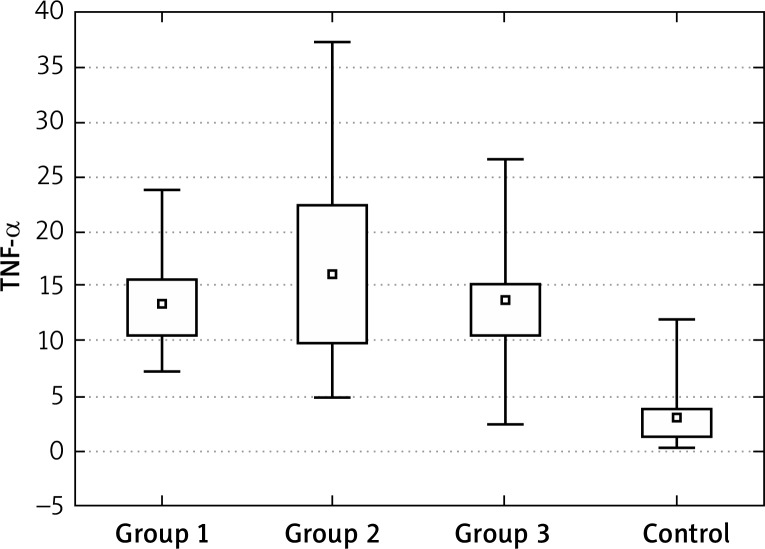
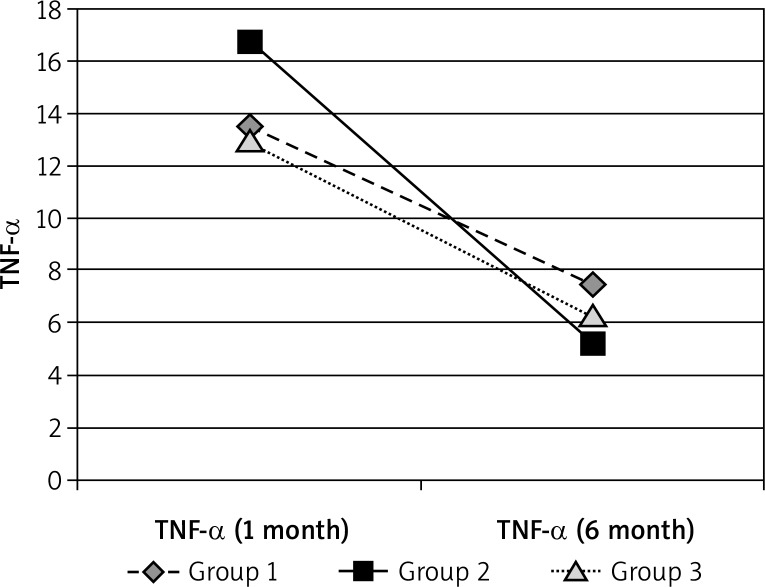
The concentration of TNF-α at the “0” visit was significantly higher in all tested groups in comparison to the control group. Also during the treatment, the blood concentrations of this cytokine decreased in groups 1, 2 and 3. The decrease in group 2 was significantly higher than in groups 1 and 3. However, the difference between the control group and the tested patients was still statistically significant and the lowest for group 2.
At 2–5 years from treatment, the values of TNF-α concentrations were similar to the healthy control group (Figures 1–4, Tables 1–5).
Figure 4.
TNF-α in at the “1” visit
Table 1.
Groups at the “0” visit
| Group | Statistics | Value of p |
|---|---|---|
| 1 – 2 | 0.963674 | 1 |
| 1 – 3 | 0.273513 | 1 |
| 1 – control | 5.703819 | < 0.0001 |
| 2 – 3 | 1.303757 | 1 |
| 2 – control | 7.095177 | < 0.0001 |
| 3 – control | 5.805042 | < 0.0001 |
Table 5.
TNF-α – groups 1, 2 and 3 and control
| Group | Statistics | Value of p |
|---|---|---|
| 1 – control | 5.720718 | < 0.0001 |
| 2 – control | 2.972704 | 0.029519 |
| 3 – control | 4.995904 | 0.000006 |
| “After years” – control | 1.043999 | 1 |
Figure 2.
TNF-α at the “0” visit
Figure 3.
TNF-α in 6 months’ observation period
Table 2.
TNF-α “0” – “1” visit
| Parameter | Group 1 | Group 2 | Group 3 |
|---|---|---|---|
| Period: 1 – 6 | |||
| Statistics t | 8.29025 | 4.197264 | 7.577981 |
| Value of p | < 0.0001 | 0.000027 | < 0.00001 |
Table 3.
Mean TNF-α “0” – “1” visit
| TNF-α | Group 1 | Group 2 | Group 3 | Control |
|---|---|---|---|---|
| 1 month | 13.4915 | 16.75174 | 12.9936 | 3.03625 |
| 6 month | 7.4485 | 5.25174 | 6.2748 |
Table 4.
TNF-α in groups 1, 2 and 3 and “after years”
| Group | Statistics | Value of p |
|---|---|---|
| 1– 2 | 2.660662 | 0.054864 |
| 1 – 3 | 1.0272 | 1 |
| 1 – “after years” | 5.563067 | < 0.0001 |
| 2 – 3 | 1.69176 | 0.54415 |
| 2 – “after years” | 2.491543 | 0.076314 |
| 3 – “after years” | 4.722258 | 0.000014 |
Interleukin 1α
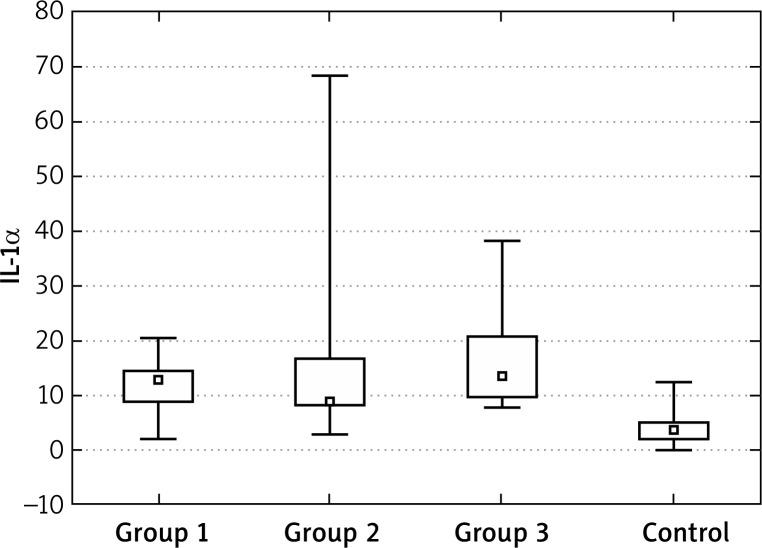
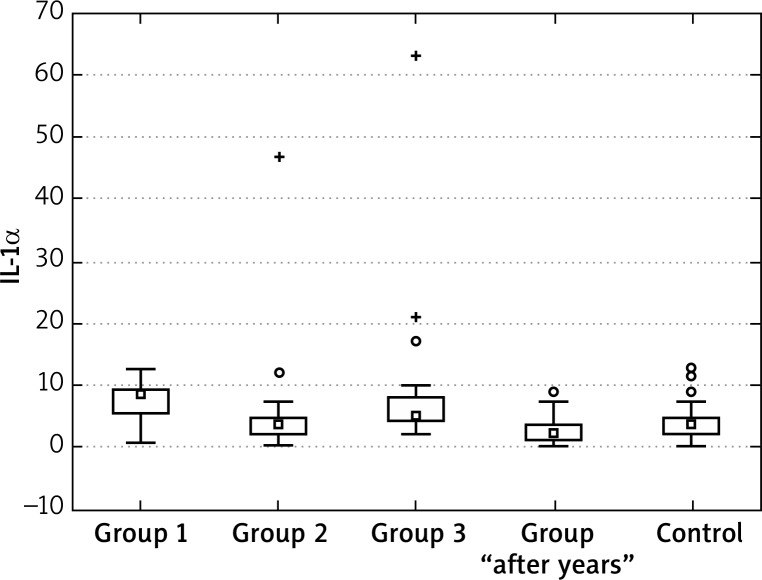
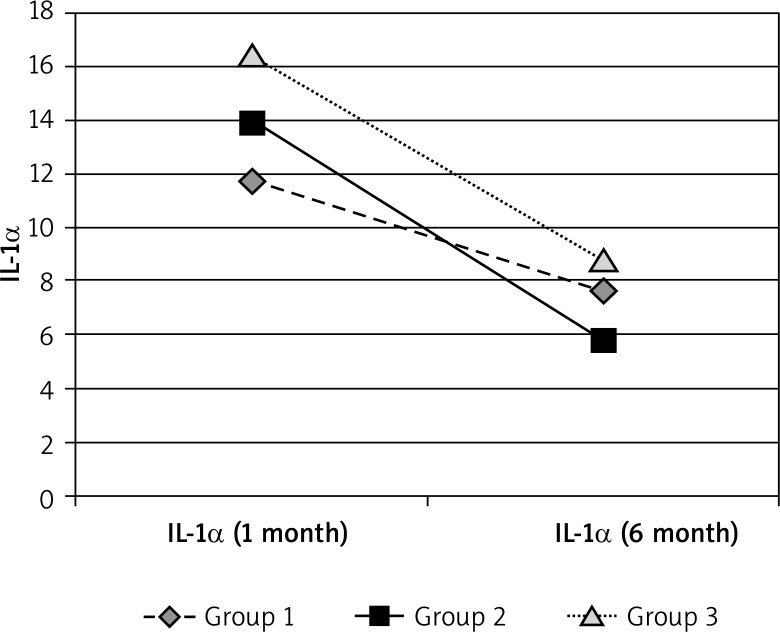
For IL-1α concentrations, we observed similar effects as for TNF-α – initially concentrations were significantly higher in all tested groups in comparison to the control group. Statistical analysis and significance levels showed that the values in group 1 and 3 after the end of treatment are still different from the control group. The values for group 2 can be considered to be similar to the control group, (here, the decreases were highest). Similarly, the IL-1α levels “after years” were similar to the control group (Figures 5–7, Tables 6–9).
Figure 5.
IL-1α at the “0” visit
Figure 7.
Mean IL-1α at the “1” visit
Table 6.
IL-1α in groups 1, 2 and 3 and control – “0” visit
| Group | Statistics | Value of p |
|---|---|---|
| 1 – 2 | 0.570826 | 1 |
| 1 – 3 | 1.318075 | 1 |
| 1 – control | 4.966432 | 0.000004 |
| 2 – 3 | 1.972644 | 0.291217 |
| 2 – control | 4.530617 | 0.000035 |
| 3 – control | 6.885778 | < 0.00001 |
Table 9.
Mean IL-1α in groups 1, 2 and 3 after 6 months
| Group | Statistics | Value of p |
|---|---|---|
| 1 – 2 | 3.076921 | 0.012549 |
| 1 – 3 | 0.625056 | 1 |
| 1 – “after years” | 5.790573 | < 0.0001 |
| 2 – 3 | 2.606991 | 0.054805 |
| 2 – “after years” | 2.124575 | 0.201733 |
| 3 – “after years” | 5.500757 | < 0.0001 |
Figure 6.
Mean IL-1α in groups 1, 2 and 3 in 6 months’ observation period
Table 7.
IL-1α – changes in time
| Parameter | Group 1 | Group 2 | Group3 |
|---|---|---|---|
| Visit: 1 – 6 | |||
| Statistics | 3.882598 | 4.197264 | 3.6997 |
| Value of p | 0.000103 | 0.000027 | 0.000216 |
Table 8.
Mean IL-1α in groups 1, 2 and 3
| IL-1α | Group 1 | Group 2 | Group 3 | Control |
|---|---|---|---|---|
| 1 month | 11.716 | 13.92609 | 16.412 | 4.17325 |
| 6 month | 7.6425 | 5.73783 | 8.8416 |
Interleukin 1β
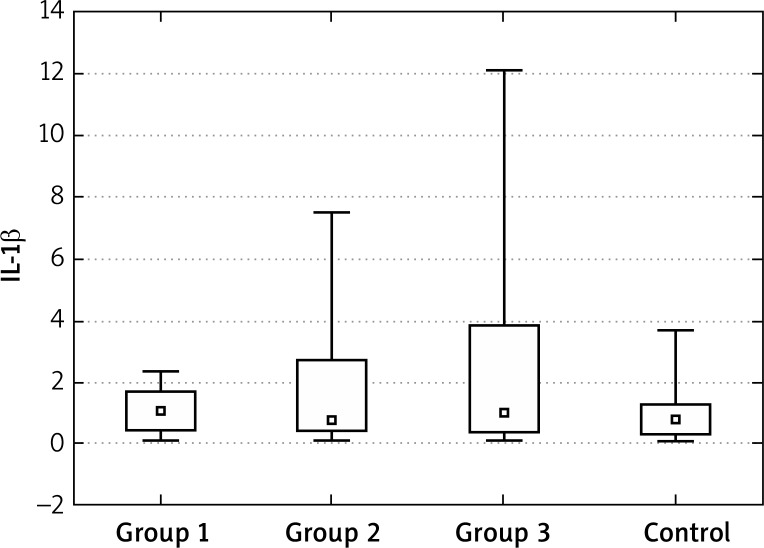
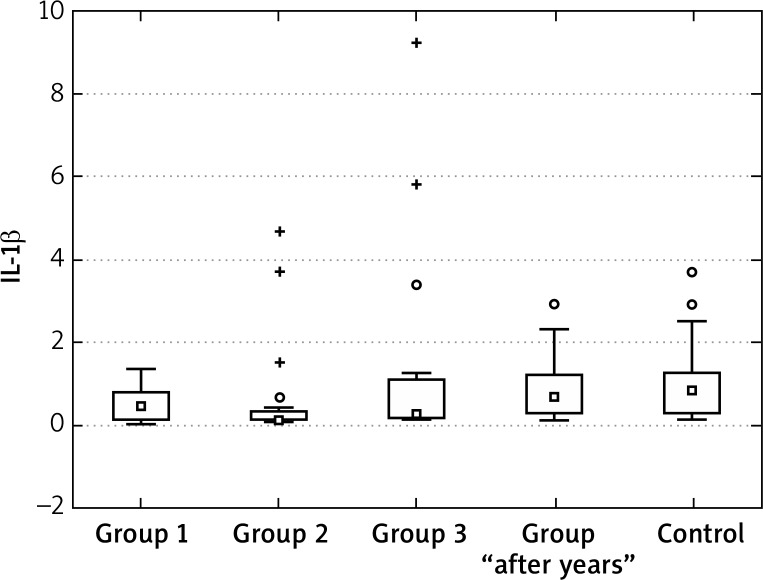
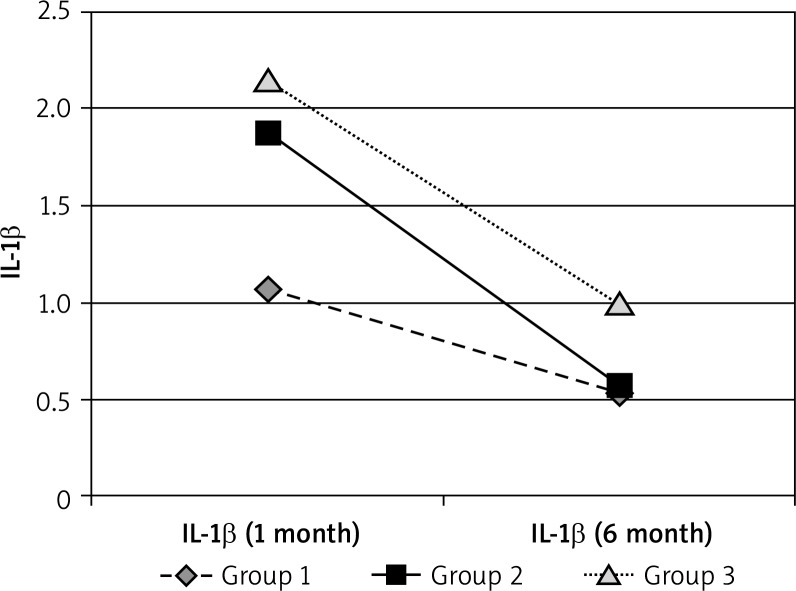
The concentrations of IL-1β at the “0” visit in patients with acne were also higher in comparison to the healthy controls. The highest decrease in the IL-1β concentrations during treatment were found for group 2. After the end of treatment the values in group 2 were also different from the control group (were lower?!). The values for group 1 and 3 can be considered to be similar to those for the control group. After 2–5 years, the IL-1β values were similar to the control group (Figures 8–10, Tables 10–12).
Figure 8.
IL-1β in groups 1, 2 and 3, control at the “0” visit
Figure 10.
Mean IL-1β after 6 months
Table 10.
Mean IL-1β in groups 1, 2 and 3
| Parameter | Group 1 | Group 2 | Group 3 |
|---|---|---|---|
| Visit: 1 – 6 | |||
| Statistics | 3.823007 | 4.106019 | 3.857143 |
| Value of p | 0.000132 | 0.00004 | 0.000115 |
Table 12.
Groups 1, 2 and 3 after 6 months, “after years” and control
| Group | Statistics | Value of p |
|---|---|---|
| 1 – 2 | 2.035938 | 0.250539 |
| 1 – 3 | 0.219577 | 1 |
| 1 – ”after years” | 1.586322 | 0.675998 |
| 2 – 3 | 1.905413 | 0.340359 |
| 2 – “after years” | 4.329239 | 0.00009 |
| 3 – “after years” | 1.993813 | 0.277035 |
| 1 – control | 1.934768 | 0.530188 |
| 2 – control | 4.280793 | 0.000186 |
| 3 – control | 1.958467 | 0.501752 |
| “After years” – control | 0.67983 | 1 |
Figure 9.
Mean IL-1β in 6 months’ observation period
Table 11.
Mean IL-1β in groups 1, 2 and 3 – changes in time
| IL-1β | Group 1 | Group 2 | Group 3 | Control |
|---|---|---|---|---|
| 1 month | 1.0655 | 1.866957 | 2.15625 | 1.0075 |
| 6 month | 0.5265 | 0.574348 | 0.9875 |
Interleukin 8
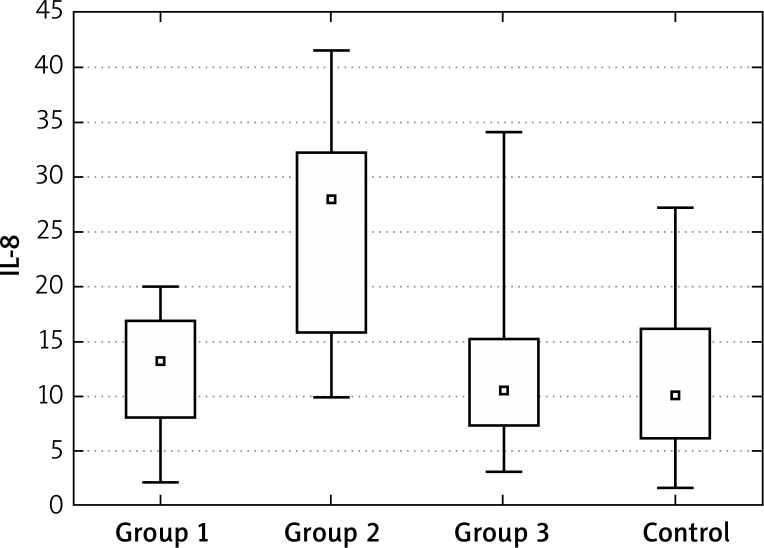
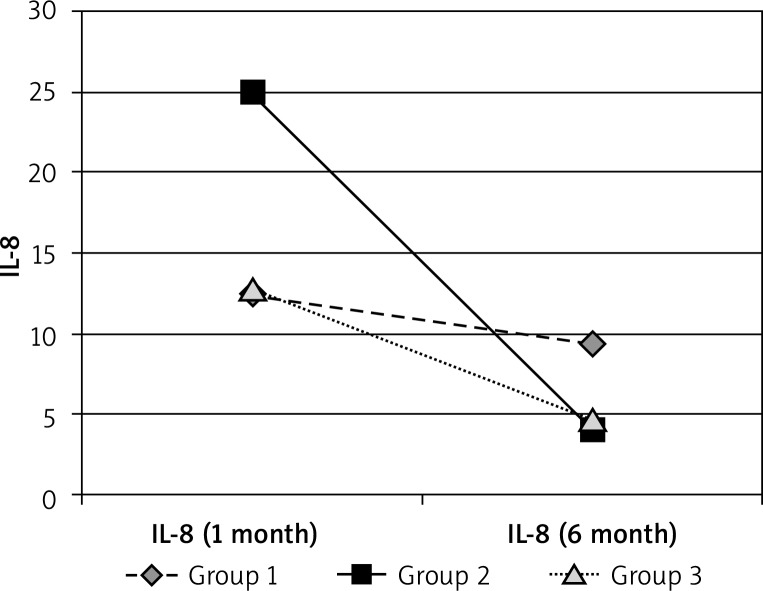
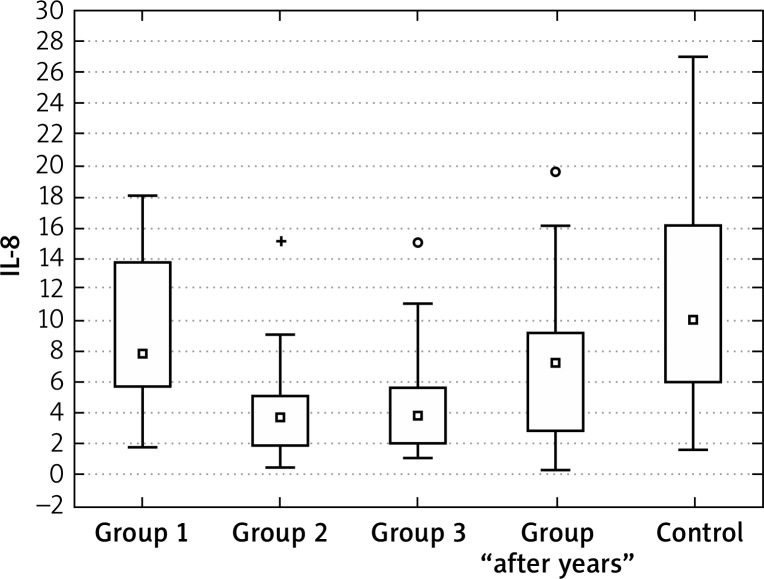
Interleukin 8 showed a significantly higher initial concentrations only in group 2 of patients with acne. The performed analyses and significance levels showed that the values after 6 months of treatment in groups 2 and 3 are different from the control group – due to a strong decrease, the values are significantly lower. For group 1, the values can be perceived as similar to the control group and the changes during the therapy were statistically insignificant. In the group “after years”, the values were similar to healthy controls (Figures 11–13, Tables 13, 14).
Figure 11.
Mean IL-8 at the “0” visit
Figure 13.
Mean IL-8 in groups 1, 2 and 3 in 6 months’ observation
Table 13.
Mean IL-8 in groups 1, 2 and 3 and control
| IL-8 | Group 1 | Group 2 | Group 3 | Control |
|---|---|---|---|---|
| 1 month | 12.406 | 24.95 | 12.7956 | 11.24059 |
| 6 month | 9.4605 | 4.014348 | 4.7536 |
Table 14.
Mean IL-8 in groups 1, 2 and 3 – changes in time
| Group | Statistics | Value of p |
|---|---|---|
| 1 – 2 | 3.955845 | 0.000458 |
| 1 – 3 | 3.386018 | 0.004255 |
| 1 – control | 1.910704 | 0.336255 |
| 2 – 3 | 0.670286 | 1 |
| 2 – control | 3.131613 | 0.010431 |
| 3 – control | 2.383061 | 0.010301 |
| 1 – “after years” | 0.438168 | 1 |
| 2 – “after years” | 4.875325 | 0.000011 |
| 3 – “after years” | 4.307615 | 0.000165 |
| “After years” – control | 3.071085 | 0.021328 |
Figure 12.
Mean IL-8 in groups 1, 2 and 3, control and “after years”
Discussion
The significance of pro-inflammatory cytokines in the pathogenesis of acne is still a subject of studies and there are few publications concerning their involvement.
The TLR2 receptors play a role in the aetiology of acne. Stimulation of TLR2 by P. acnes makes the IL-8 and IL-12 concentrations increase. Macrophages surrounding the pilosebaceous unit with TLR2 receptors were histologically described in biopsy materials of patients with acne.
Using immunohistochemical methods, the expression of IL-1α and IL-1β has been demonstrated within sebaceous glands [6–8].
Investigation of the role of IL-1α in acne, was provided on the models of pilosebaceous units. The results obtained by enzyme-linked immunosorbent assay (ELISA) show that the levels of interleukin-1 (IL-1) were higher in sera even in patients with subclinical stages of acne. Also levels of IL-1 receptor antagonist (IL-1ra), the natural inhibitor of IL-1, were markedly higher in these people [9, 10].
Szabo et al. [11] described the role of genetic polymorphisms of TNF-α in patients with acne. Tumour necrosis factor α is a central molecule coded by a gene that shows a high level of genetic polymorphisms especially in its promoter region. Single nucleotide polymorphisms (SNPs) of the TNF-α gene have been shown to be associated with an increased risk to develop chronic inflammatory diseases. In order to find out whether known TNF-α regulatory SNPs (–1031T > C, –857C > T, –863C > A, –308G > A, –238G > A) have a role in the development of the inflammatory reactions in acne vulgaris. The author analyzed a genomic collection in a retrospective case-control study using the PCR-RFLP method, and we compared the resulting genotype and allele frequencies. There were no significant differences in the observed genotype or allele frequencies between the control and acne group in the case of the –1031, –863, –238 SNPs; however, the TNF-α –857 minor T allele was found to act as a protective factor in our study population in acne, and a higher occurrence of the minor –308 A allele in female acne patients was also noted.
In our study, the concentration of TNF-α at the “0” visit was significantly higher in all tested groups in comparison to the control group. Also during the treatment, the blood concentrations of this cytokine decreased in groups 1, 2 and 3. The decrease in group 2 was significantly higher than in groups 1 and 3. However, the difference between the control group and the tested patients was still statistically significant and the lowest for group 2.
At 2–5 years from treatment, the values of TNF-α concentrations were similar to the healthy control group.
For IL-1α concentrations, we observed similar effects as for TNF-α – initially concentrations were significantly higher in all tested groups in comparison to the control group. Statistical analysis and significance levels showed that the values in group 1 and 3 after the end of treatment are still different from the control group. The values for group 2 can be considered to be similar to the control group (here, the decreases were highest). Similarly, the IL-1α levels “after years” were similar to the control group.
The concentrations of IL-1β at the “0” visit in the patients with acne were also higher in comparison to the healthy controls. The highest decrease in the IL-1β concentrations during treatment were found for group 2. After the end of treatment, the values in group 2 were also different from the control group (were lower?!). The values for group 1 and 3 can be considered as similar to those for the control group. After 2–5 years the IL-1β values were similar to the control group.
Interleukin 8 showed significantly higher initial concentrations only in group 2 of patients with acne. The performed analyses and significance levels showed that the values after 6 months of treatment in groups 2 and 3 are different from the control group – due to a strong decrease, the values are significantly lower. For group 1 the values can be perceived as similar to the control group and the changes during the therapy were statistically insignificant. In the group “after years” the values were similar to healthy controls.
Guruvayoorappan and Kuttan [12] stated that the cytokine profile in the serum of animals showed a drastically increased level of proinflammatory cytokines such as IL-1β, TNF-α, IL-6, granulocyte-macrophage colony-stimulating factor (GM-CSF) and the direct endothelial cell proliferating agent, vascular endothelial growth factor (VEGF) during the onset of angiogenesis. Administration of 13-cis-retinoic acid could differentially regulate these cytokine's elevation. The differential elevation is further evidenced by the increased production of IL-2 and tissue inhibitor of metalloprotease-1 (TIMP-1) in the 13-cis-retinoic acid treated animals. Aortic ring assay for in vitro angiogenesis revealed that 13-cis-retinoic acid could markedly inhibit the microvessel sprouting. Moreover, 13-cis-retinoic acid was able to inhibit vascular endothelial cell proliferation, migration and tube formation. Furthermore, 13-cis-retinoic acid treatment could inhibit the activation and nuclear translocation of p65, p50, c-Rel subunits of nuclear factor-κB, and other transcription factors such as c-fos, activated transcription factor-2, and cyclic adenosine monophosphate response element-binding protein in B16F-10 melanoma cells.
In another investigation on the laboratory animals, after low and high doses of 13-cis-retinoic expression of chemokines (MCP-1/CCL2, MIP-1α/CCL3, IP-10/CXCL10, RANTES/CCL5) and proteins associated with fibrosis (plasminogen activator inhibitor-1, transforming growth factor-β1, and collagens I and III) were strikingly lower. In vitro, activated peritoneal macrophages of 13cRA-treated rats showed a pronounced decrease in protein secretion of inflammatory cytokines (e.g. tumour necrosis factor-α, IL-6). In summary, 13cRA acted as a potent immunosuppressive and anti-fibrotic agent able to prevent and inhibit progression.
Ghasri and Scheinfeld [14] described oral alitretinoin (9-cis-retinoic acid) is a unique pan-agonist retinoid with immunomodulatory and anti-inflammatory activity, which inhibited production of IL-1, TNF-α and IL-12 p 40.
Bodo et al. [15] analysed the production of FGF 7 by fibroblasts, stimulated by IL-1α. Deletion of the gene for fibroblast growth factor (FGF) caused atrophy of sebaceous gland in animals. The author concluded that FGF plays a role in aetiology of acne and lipogenesis.
In another study the authors noticed that all-trans-retinoic acid appears to affect Th1–Th2 differentiation and its effects on immune responses might also be mediated by dendritic cell. Vitamin A derivatives were detrimental on IL-4 property as a dendritic cell inductor [16].
Conclusions
On the basis of performed analyses, it was concluded that isotretinoin caused a decrease in pro inflammatory cytokine level (IL-1α, IL-1β and TNF-α). The best therapy scheme is the use of a constant drug dose – 0.4–1.0 mg/kg bw/day without modification during treatment. Measurements of IL-1α, IL-1β and TNF-α sera concentrations could be assessed in parallel to the improvement of the clinical condition and can constitute a good indication of the efficiency of isotretinoin treatment. Interleukin-8 is not a good evaluation parameter because the level of IL-8 showed a significantly higher initial concentration only in group 2 of patients with acne.
References
- 1.Bergler-Czop B, Brzezińska-Wcisło L. Dermatological problems of the puberty. Postep Derm Alergol. 2013;30:178–87. doi: 10.5114/pdia.2013.35621. [DOI] [PMC free article] [PubMed] [Google Scholar]
- 2.Rivera R, Guerra A. Managment of acne in women over 25 years of age. Actas Dermosifiogr. 2009;100:33–7. [PubMed] [Google Scholar]
- 3.James KA, Burkhart CN, Morell DS. Emergering drugs for acne. Expert Opin Emerg Drugs. 2009;14:649–59. doi: 10.1517/14728210903251690. [DOI] [PubMed] [Google Scholar]
- 4.Shamban AT, Narurkar VA. Multimodal treatment of acne, acne scars and pigmentation. Dermatol Clin. 2009;27:459–71. doi: 10.1016/j.det.2009.08.010. [DOI] [PubMed] [Google Scholar]
- 5.Plewig G. How acne vulgaris develops. Hautarzt. 2010;61:99–100, 102-104, 106. doi: 10.1007/s00105-009-1829-7. [DOI] [PubMed] [Google Scholar]
- 6.Webster G, Rawlings A, Acne Trądzik. Lublin: Czelej; 2009. Diagnostics and treatment [Polish] [Google Scholar]
- 7.Cunliffe WJ, Holland DB, Clark SM, et al. Comedogenesis: some new aetiological, clinical and therapeutic strategies. Br J Dermatol. 2000;142:1084–91. doi: 10.1046/j.1365-2133.2000.03531.x. [DOI] [PubMed] [Google Scholar]
- 8.Kim J, Ochoa M, Krutzik SR. Activation of toll-like receptor 2 in acne tiggers inflammatoty cytokine responses. J Immunol. 2002;169:1536–41. doi: 10.4049/jimmunol.169.3.1535. [DOI] [PMC free article] [PubMed] [Google Scholar]
- 9.Bodo M, Carinci F, Baroni T, et al. Apert's syndrome: differential in vitro production of matrix macromolecules and its regulation by interleukins. Eur J Clin Invest. 1997;27:36–42. doi: 10.1046/j.1365-2362.1997.660618.x. [DOI] [PubMed] [Google Scholar]
- 10.Zoubolis CC. Modern aspects of acne pathogenesis. J Dtsch Dermatol Ges. 2010;1:7–14. doi: 10.1111/j.1610-0387.2009.07168.x. [DOI] [PubMed] [Google Scholar]
- 11.Szabo K, Tax G, Teodorescu-Brinzeu D, et al. TNF alfa gene polymorphisms in the pathogenesis of acne vulgaris. Arch Dermatol Res. 2011;303:19–27. doi: 10.1007/s00403-010-1050-7. [DOI] [PubMed] [Google Scholar]
- 12.Guruvayoorappan C, Kuttan G. 13 cis-retinoic acid regulates cytokine production and inhibits angiogenesis by disrupting endothelial cell migration and tube formation. J Exp Ther Oncol. 2008;7:173–82. [PubMed] [Google Scholar]
- 13.Adams J, Kiss E, Arroyo AB, et al. 13-cis retinoic acid inhibits development and progression of chronic allofraft nephropathy. Am J Pathol. 2005;167:285–98. doi: 10.1016/S0002-9440(10)62973-2. [DOI] [PMC free article] [PubMed] [Google Scholar]
- 14.Ghasri P, Scheinfeld N. Update on the use of alitretinoin in treating chronic hand eczema. Clin Cosmet Invest Dermatol. 2010;3:59–65. doi: 10.2147/ccid.s6495. [DOI] [PMC free article] [PubMed] [Google Scholar]
- 15.Bodo M, Carinci F, Baroni T, et al. Interleukin pattern of Apert fibroblasts in vitro. Eur J Cell Biol. 1998;75:383–8. doi: 10.1016/S0171-9335(98)80072-1. [DOI] [PubMed] [Google Scholar]
- 16.de Sousa-Canavez JM, de Oliveira Massoco C, de Moraes-Vasconcelos D, et al. Retinoic acid inhibits dendritic cell differentation driven by interleukin-4. Cell Immunol. 2009;259:41–8. doi: 10.1016/j.cellimm.2009.05.011. [DOI] [PubMed] [Google Scholar]


