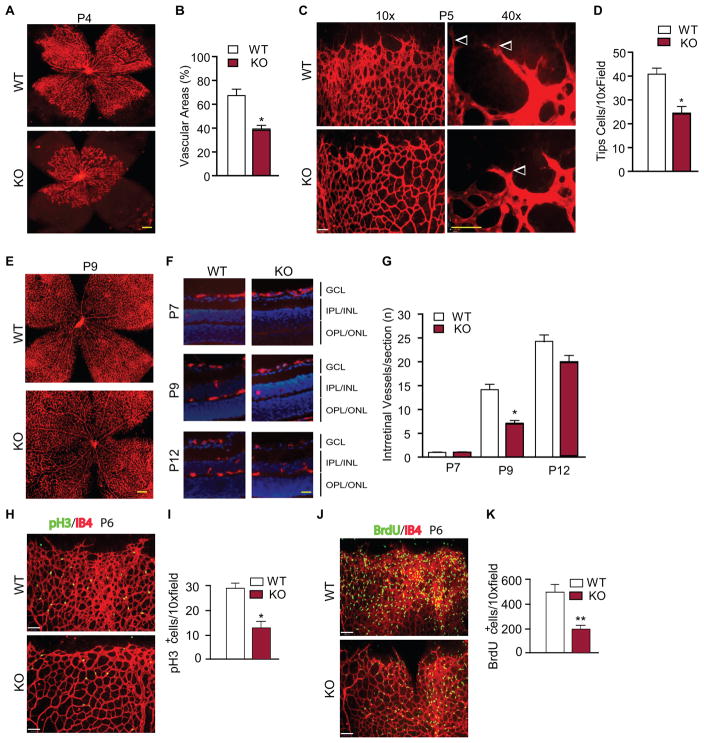
Figure 1. Effect of a global AIP1 deletion in retinal vascular development.
Retinas from WT (AIP1lox/lox) and the global AIP1-KO (AIP1lox/lox:β-actin-Cre) at P3 to P17 were collected. A–B. The superficial retinal vasculatures were visualized by isolectin B4 staining. Images from P4 are shown (A). Scale bar: 500 μm. Vascularized areas were quantified as a percentage of the total retinal surface (B). n=10 retinas from 5 mice for each strain. C–D. Representative images of retina tips cells (indicated by arrowheads) from WT and AIP1-KO are shown (C). Scale bar: 50 μm. Tip cells were quantified (D). Data are mean ± SEM from 5 mice for each group. *, p<0.05 comparing AIP1-KO to WT. E–G. The superficial retinal vasculatures at P9 are shown (E). Scale bar: 500 μm. Intraretinal vessels from GCL into deeper IPL and OPL layers were examined by isolectin staining of eye cross sections. Images from P7, P9 and P12 are shown (F). Scale bar: 50 μm. Intraretinal vessel number/section was quantified (G). Data are mean ± SEM from 3 sections of each retina and 10 retinas from 5 mice for each group. *, p<0.05 comparing AIP1-KO to age-match WT. H–I. P6 retinas were subjected to whole mount staining with isolectin for EC (red) and phosphor-histone-3 (pH3) for proliferative cells (green). Representative images are shown (H). Scale bar: 50 μm. pH3-positive cells are quantified (I). Data are mean ± SEM from 3 pairs of WT and AIP1-KO. *, p<0.05 comparing AIP1-KO to age-match WT. J–K. P6 WT and AIP1-KO mice were injected with BrdU for 2 h and retinas were subjected to whole-mount staining with isolectin for EC (red) and anti-BrdU for proliferative cells (green). Representative images are shown (J). Scale bar: 50 μm. BrdU-positive cells are quantified (K). Data are mean ± SEM from 3 pairs of WT and AIP1-KO. *, p<0.05 comparing AIP1-KO to age-match WT.

