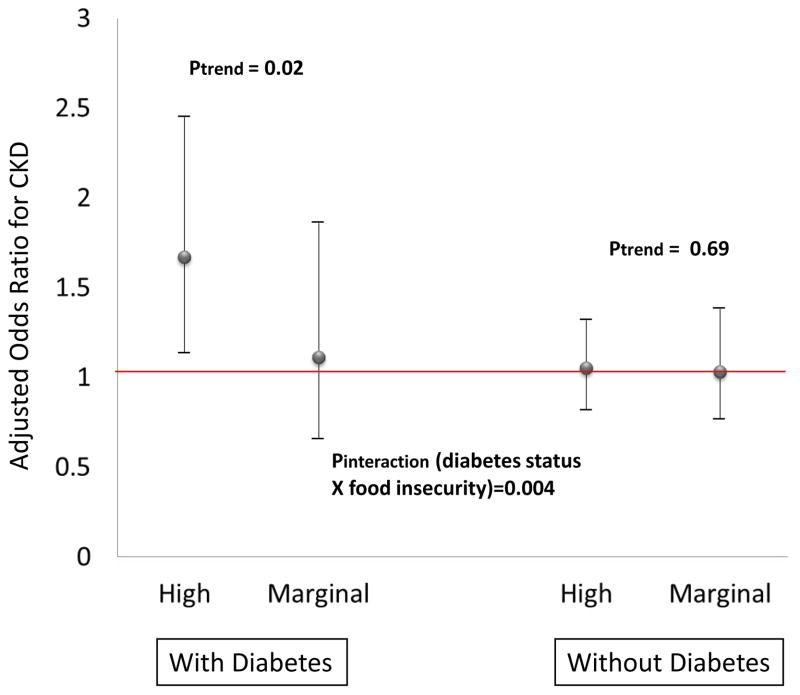
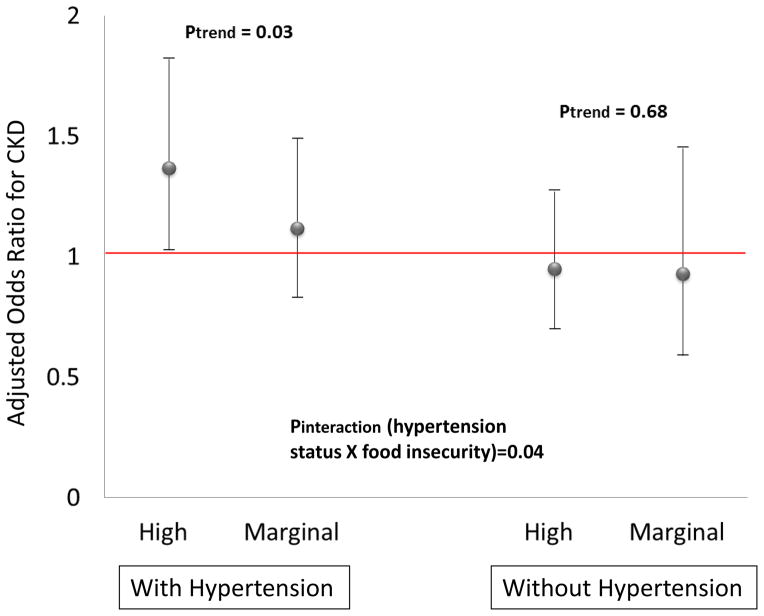
Figure 2.
(Panel a) Adjusted Odds Ratios for CKD Comparing High or Marginal Food Insecurity Groups to the No Food Insecurity Group (Reference), Among Lower Income Persons With or Without Diabetes, NHANES 2003–2008 [Adjusted for sociodemographic factors (age, race/ethnicity, sex, education, marital status, insurance, poverty income ratio, and smoking status)].
(Panel b) Adjusted Odds Ratios for CKD Comparing High or Marginal Food Insecurity Groups to the No Food Insecurity Group (Reference), Among Lower Income Persons With or Without Hypertension, NHANES 2003–2008 [Adjusted for sociodemographic factors (age, race/ethnicity, sex, education, marital status, insurance, poverty income ratio, and smoking status)].


