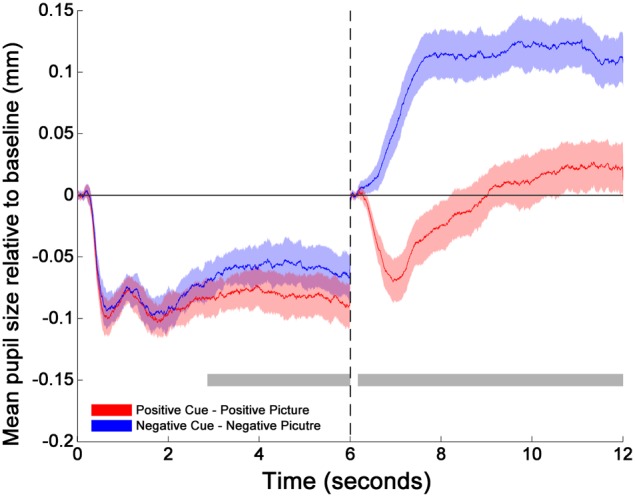
Figure 1.

Changes in pupil size relative to baselines across time for cues and pictures. The transition of the two phases is marked by the dotted line at 6 s. The two horizontal gray bars mark the time windows within which the differences between positive (red solid line) and negative (blue solid line) emotion trials are statistically significant as indicated by the cluster thresholding method. The colored shades surrounding each mean pupil responses (solid lines) indicate the 95% confidence intervals of the difference between Positive and Negative emotion trials. They are constructed based on the critical paired-sample t scores at each time point (Standard Error × t scores at the 2.5 and 97.5th percentiles of the permuted t distribution). 0–165 and 6000–6165 ms were the baseline periods.
