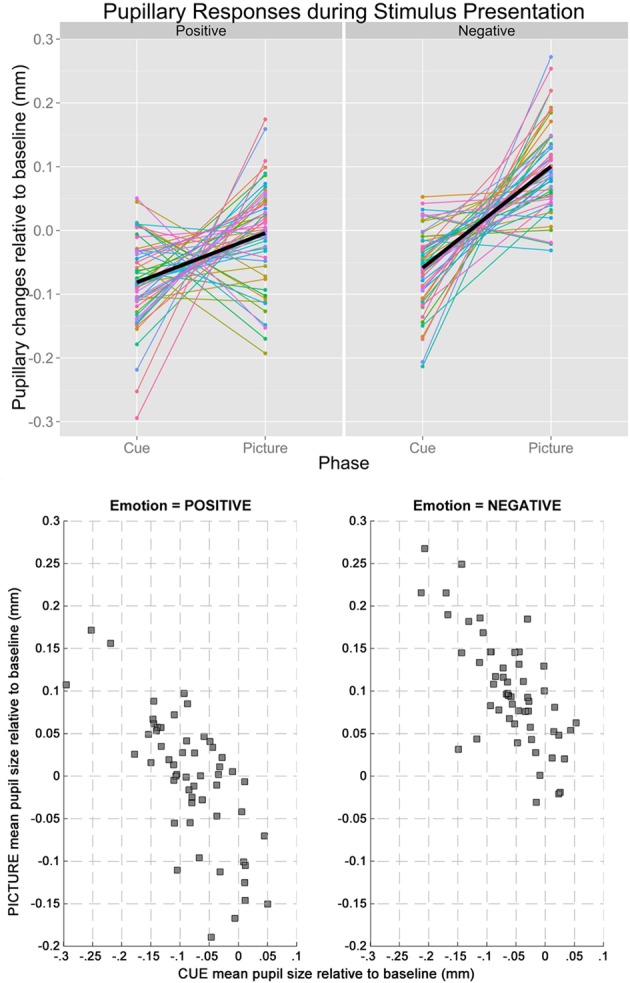
Figure 2.

The upper panel shows the line plot illustrating the changes in baseline-adjusted pupil diameters from cue to picture of individual participants. Regardless of emotion (left: positive, right: negative), pupillary changes tended to have opposite signs during the two stages of stimulus presentation, explaining the inverse correlations. The lower panel shows the scatterplots between mean pupil sizes during cue and picture when the Emotion of the trials was positive (left) and negative (right).
