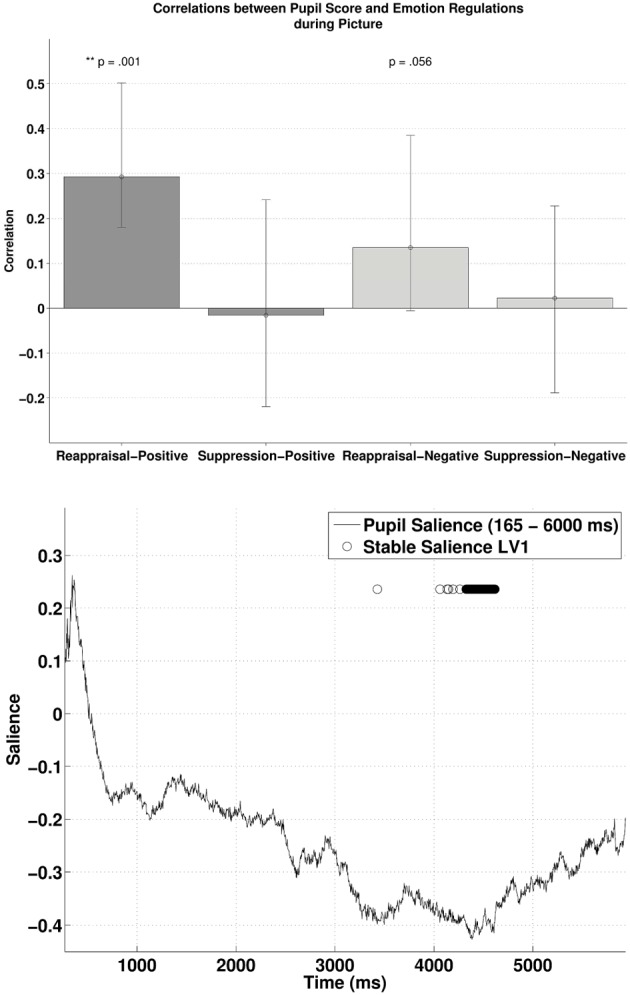
Figure 4.

The upper panel shows the correlations between participants' pupillary responses and the ERQ scores in Latent Variable 1 during picture presentation. Error bars represent boot-strapped 95% confidence intervals. The lower panel shows that the saliences are in general negative, implying that the reappraisal correlations are interpreted as: the higher the rating, the smaller the pupillary responses (or alternatively, a tendency from dilation to constriction).
