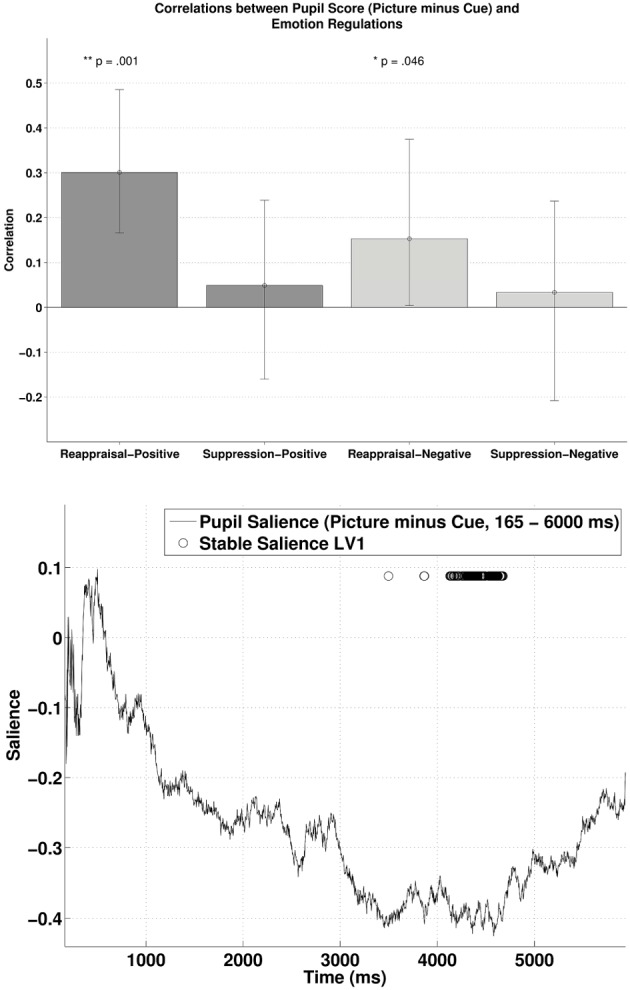
Figure 5.

The upper panel shows the correlations between participants' pupillary responses and the ERQ scores in Latent Variable 1, with the scores derived from the difference in pupillary responses between cue and picture presentation phases (Picture minus Cue). Error bars represent boot-strapped 95% confidence intervals. The lower panel shows that the saliences are in general negative, implying that the reappraisal correlations are interpreted as: the higher the scores, the less positive/ more negative the difference in pupillary responses.
