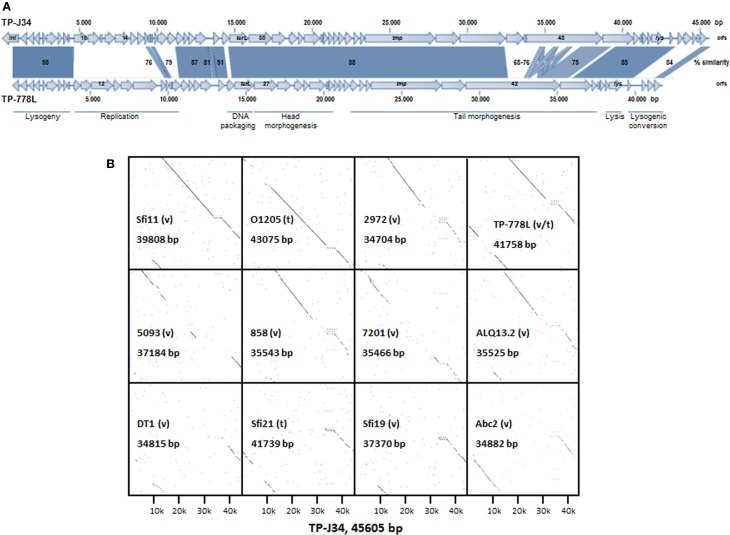
Figure 3.
(A) Alignment of gene maps and functional gene regions of TP-J34 and TP-778L. On the genetic maps, genes, and direction of transcription are indicted by arrows (very small genes are shown as boxes, the directions of transcription correspond to adjacent genes). Numbers or gene abbreviations refer to orfs or genes as listed in Tables 3, 4. A scale indicating nucleotide positions is shown above the TP-J34 map. Approximate positions of functional regions (modules) are indicated by horizontal bars below the TP-778L map. Positions of CRISPR spacer sequences are indicated by dots above and below the maps of TP-J34 and TP-778L, respectively. (B) Dot plots of the TP-J34 nucleotide sequence compared to those of other S. thermophilus phages, including TP-778L. The horizontal line of each dot plot represents the 45,605 bp of TP-J34 DNA, whereas the vertical lines represent the numbers of bp for each phage, as indicated within each dot plot. Temperate (t) and virulent (v) phages are indicated.

