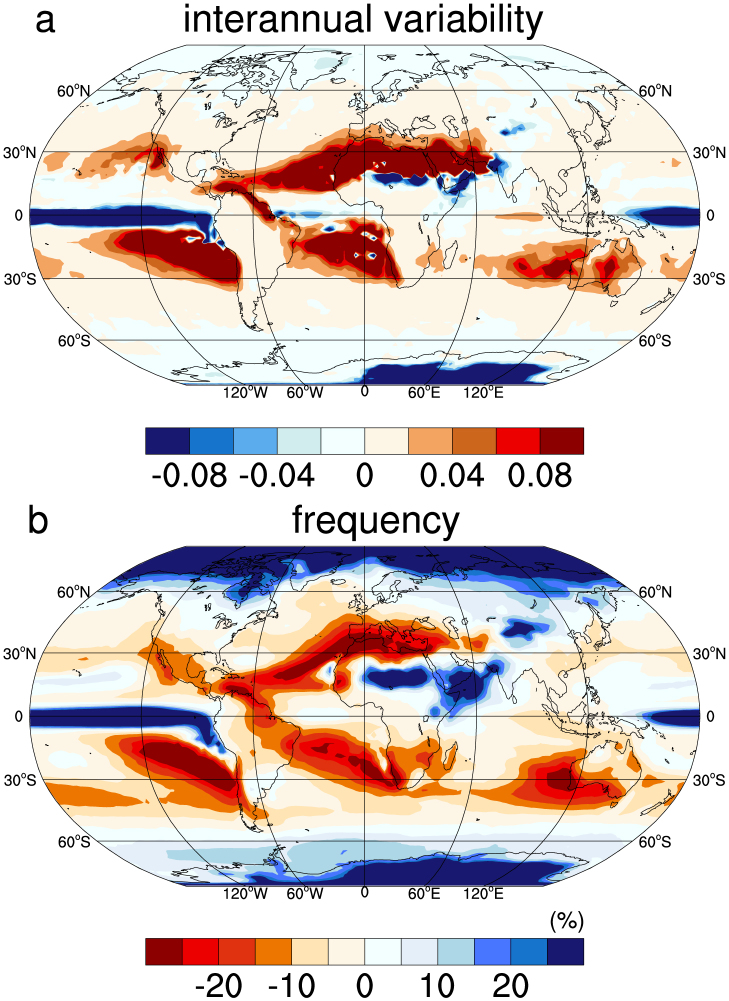
Figure 5. CMIP5 multi-model ensemble average change in (a) interannual variability of precipitation scaled by historical mean annual precipitation; (b) frequency of precipitation days (%).
Values are computed over the period 2060–2089, relative to the historical period 1960–1989, using the RCP8.5 forcing scenarios. Maps were produced using NCAR Command Language (NCL; Ref. 30).

