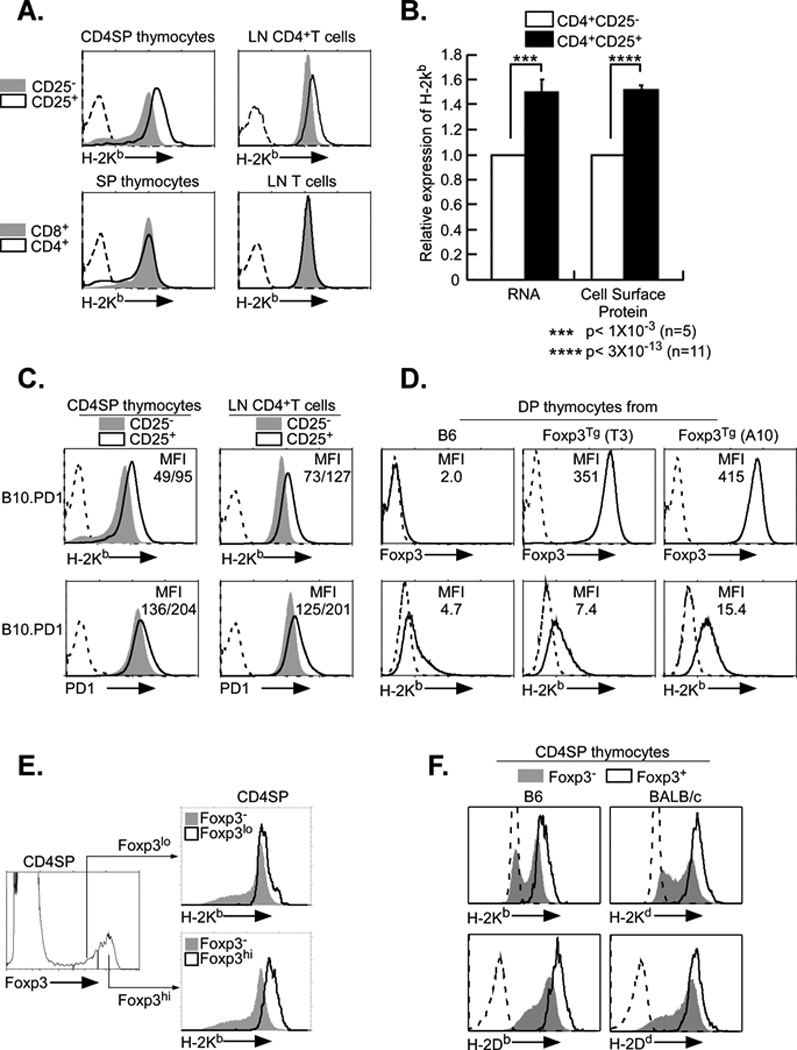
Figure 1. MHC class I expression is elevated on Tregs.

A. Surface expression of MHC class I is elevated on CD4+CD25+ T cells from thymus and lymph node relative to CD4+CD25− T cells. Upper panels: Thymocytes (left) and lymph node cells (LN, right) were stained for H2-Kb, CD4 and CD25, as described in Materials and Methods. FACS profiles of class I expression on the CD4+CD25+ (black line) and CD4+CD25− (shaded) populations are shown. Lower panels. Class I levels on CD8+ (shaded) and CD4+ (black line) thymocytes (left) and lymph nodes (right) were determined by staining for CD4, CD8 and H-2Kb.
B. Class I RNA and cell surface protein levels are elevated in CD4+CD25+ T cells relative to CD4+CD25− T cells. Total RNA was isolated from purified Tregs and Tconv and subjected to RT-PCR (left). Cell surface class I protein levels were calculated from total mean fluorescence intensity (MFI) following FACS profiling with anti-H-2Kb antibody (right). Both sets of results are presented relative to CD4+CD25− Tconv levels. ***p<0.001 (n=5); ****p<0.0001 (n=11).
C. Expression of a class I transgene is elevated on CD4+CD25+ T cells in thymus and lymph node. Thymocytes and lymph nodes from mice transgenic for the MHC class I gene, PD1, were stained for endogenous H2-Kb (upper panels), transgenic PD1 (lower panels), CD4 and CD25, as described in Materials and Methods. FACS profiles of class I expression on the CD4+CD25− (shaded) and CD4+CD25+ (black line) populations are shown. Mean fluorescence intensity (MFI) is indicated for CD25+/CD25−. The data are representative of three experiments.
D. Levels of MHC class I expression correlate with levels of Foxp3 expression. Double positive (DP) thymocytes were isolated from B6 mice and two lines of Foxp3 transgenics, T3 and A10. Expression of Foxp3 (upper panels) and H-2Kb (lower panels) were monitored by FACS. Foxp3 staining (solid line) and negative control (dotted line) are shown; MFI of Foxp3 and H-2Kb staining are indicated. The data are representative of three experiments.
E. Class I expression is proportional to Foxp3 levels in native Tregs. CD4 single positive thymocytes were stained for Foxp3 (left) and H-2Kb (right). The expression of H-2Kb on Foxp3 high (right, lower panel) and Foxp3 low (right, upper panel) cells is compared to Foxp3 negative cells. The data are representative of three experiments.
F. MHC class I expression is elevated on CD4+Foxp3+ thymocytes relative to CD4+Foxp3− thymocytes. Thymocytes from B6 and BALB/c were surface stained for H2-Kb, H-2Db, H-2Kd, H-2Dd, CD4 and CD8, fixed and stained for intracellular Foxp3. FACS profiles of class I expression on the CD4+Foxp3+ (black line) and CD4+Foxp3- (shaded) populations are shown. The data are representative of three experiments.
