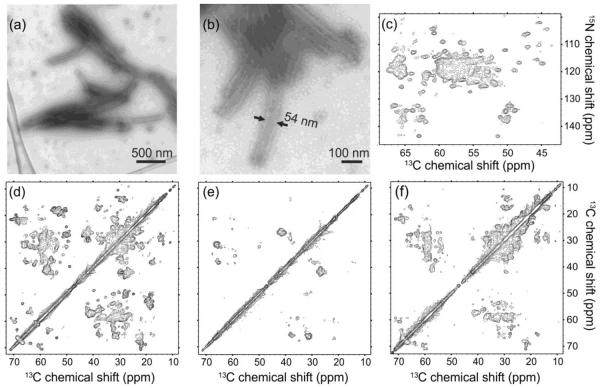
Figure 1.
Characterization of HIV-1 CA tubes by electron microscopy and solid state NMR. (a,b) TEM images of negatively stained CA tubes. (c) 2D NCACX solid state NMR spectrum of U-CA tubes, showing only the region that contains 15N-13Cα crosspeaks. (d,e,f) Aliphatic regions of 2D 13C-13C MAS NMR spectra of U-CA, 2-CA, and 1,3-CA tubes, respectively, with 4.0 ms RFDR mixing periods. All 2D spectra were obtained at 14.1 T with MAS at 12.00 kHz. Contour levels increase by successive factors of 1.5.

