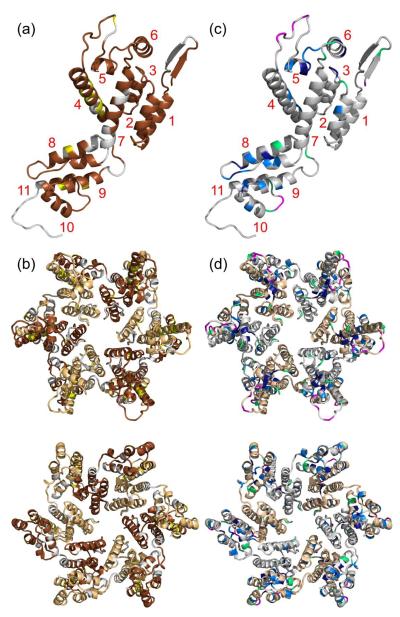
Figure 5.
Summary of information concerning local order and dynamics. (a) Cartoon representation of a CA monomer (from PDB code 2LF4) with unambiguously assigned residues in brown and tentatively assigned residues in yellow. Residues in gray have assignment consistencies below 80%, including residues to which solid state NMR signals are never assigned. Helical segments of CA are labeled in red. According to solid state NMR data, the 310-helix, between helices 7 and 8, is not present in our CA tubes. (b) CA hexamer (from PDB code 3GV2) with the same coloring as in panel a, except that dark brown and light brown are used for alternate CA molecules. The hexamer is viewed from outside a CA tube (top) and from inside a CA tube (bottom). (c) CA monomer with residues colored according to percentages in Figure 4b, with dark blue, light blue, green, and magenta corresponding to values of 15–30%, 31–40%, 41–55%, and 56–85%, respectively. Residues whose crosspeak signals are insufficiently resolved in the 1H T2-filtered NCA spectra are gray. (d) CA hexamer with the same coloring as in panel c, except that gray and light brown are used for alternate CA molecules. The hexamer is viewed from outside a CA tube (top) and from inside a CA tube (bottom).

