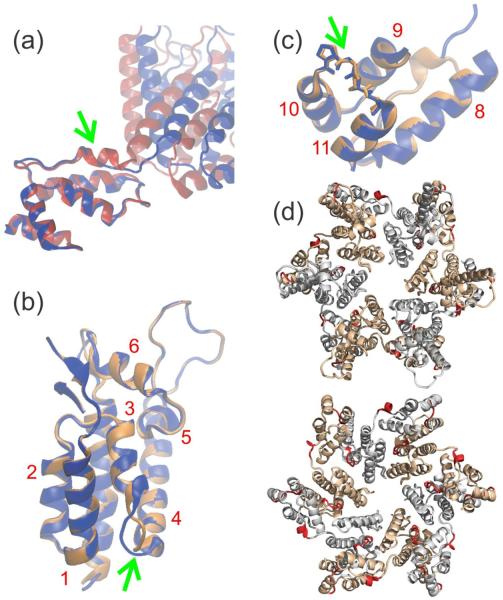
Figure 7.
Changes in published CA structures required to fit solid state NMR restraints on the CA structure within tubular assemblies. (a) Comparison of initial (red) and final (blue) structures, with optimal superposition of CTD segments, from a restrained molecular dynamics/simulated annealing calculation that used a CA monomer structure from solid state NMR (PDB code 2LF4) as the initial structure. The 310-helix near the NTD-CTD linker in the initial structure, indicated by the green arrow, changes to an extended conformation in order to accommodate solid state NMR chemical shift and 15N-BARE data. (b,c) Comparison of initial (orange) and final (blue) structures from a calculation that used a CA hexamer structure from X-ray crystallography (PDB code 3MGE) as the initial structure. Either NTD (helices 1–7) or CTD (helices 8–11) segments are optimally superposed. Green arrows indicate conformational changes between helices 3 and 4 (near the intermolecular NTD-CTD interface in a CA hexamer) and helices 10 and 11 (near the local three-fold axis in a CA lattice). Helical segments of CA are labeled in red. (d) CA hexamer (from PDB code 3GV2) with segments that exhibit conformational changes colored red. The hexamer is viewed from outside a CA tube (top) and from inside a CA tube (bottom). Segments in which conformational changes are not identified by our data are gray and light brown in alternate CA molecules.

