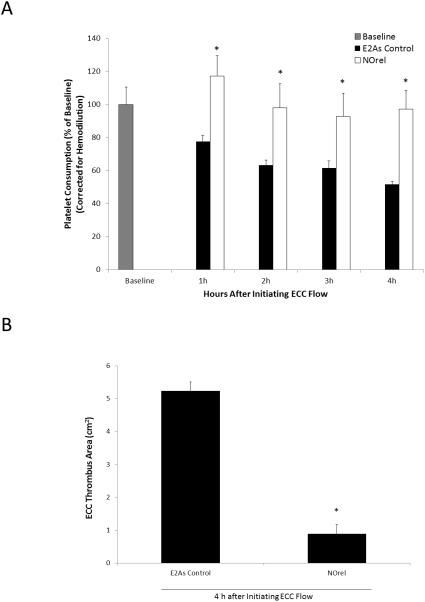
Fig. 4.
(A) Time dependent effects of NOrel ECC (25 wt% DBHD/N2O2 + 10 wt% 5050DLG7E PLGA in E2As) as compared to control ECC on rabbit platelet count (i.e. consumption) as measured via Coulter counter. (B) Quantitation of thrombus area as calculated with NIH ImageJ software using a 2D representation of thrombus. The data are means ± SEM. * = p < 0.05, control vs. NOrel ECC circuits.

