
Fig. 1.
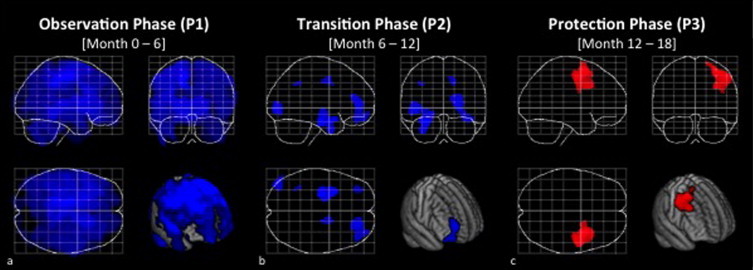
Regional gray matter volume increase in testosterone treated men with MS. (a) Significant gray matter changes during the observation phase, (b) the transition phase, and (c) the protection phase, threshold at p≤ 0.05, FWE-corrected for multiple comparisons. Displayed are maximum intensity projections superimposed onto the SPM standard glass brain together with a rendering onto the mean template. Decreases are shown in blue, increases in red. Note the significant gray matter increase (accompanied by a lack of significant gray matter decrease) during the protection phase.