
Figure 3.
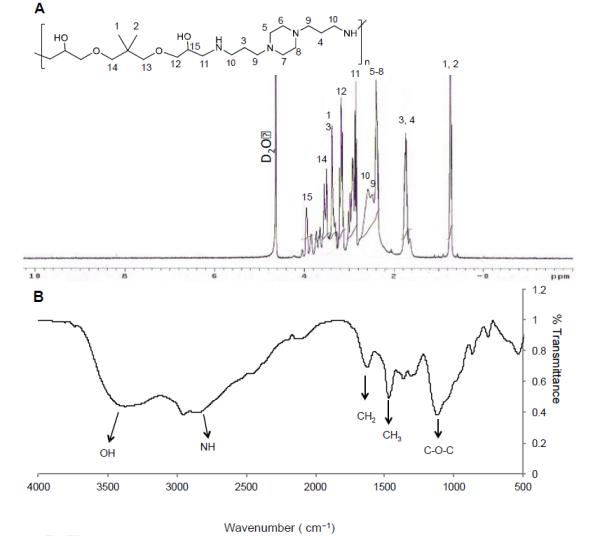
The NPGDE-1,4 Bis polymer. (A) 1H-NMR spectrum. The numbers in the figure represent each proton in the chemical structure of polymer, and the corresponding 1H-NMR peaks were designated accordingly. (B) FT-IR absorption spectrum.
Official websites use .gov
A
.gov website belongs to an official
government organization in the United States.
Secure .gov websites use HTTPS
A lock (
) or https:// means you've safely
connected to the .gov website. Share sensitive
information only on official, secure websites.
The NPGDE-1,4 Bis polymer. (A) 1H-NMR spectrum. The numbers in the figure represent each proton in the chemical structure of polymer, and the corresponding 1H-NMR peaks were designated accordingly. (B) FT-IR absorption spectrum.