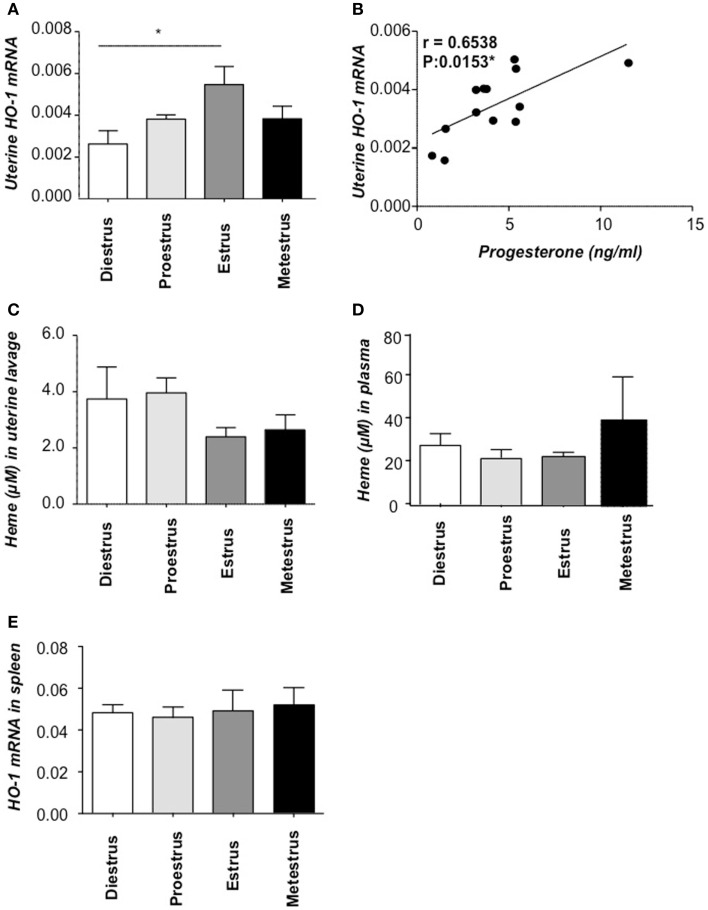
Figure 3.
HO-1 and heme levels at different phases of the estrous cycle. (A) HO-1 mRNA levels in uterine tissue of Hmox1+/+ female mice (n = 4/phase) and (B) the positive correlation between HO-1 mRNA levels in the uterus and progesterone concentrations in serum. (C) The levels of heme in uterine lavage and (D) heme levels in plasma. (E) HO-1 mRNA levels in spleen of Hmox1+/+ female mice. *p < 0.05, n = 4 mice/phase were included and the statistic analysis was performed by two-way ANOVA.

