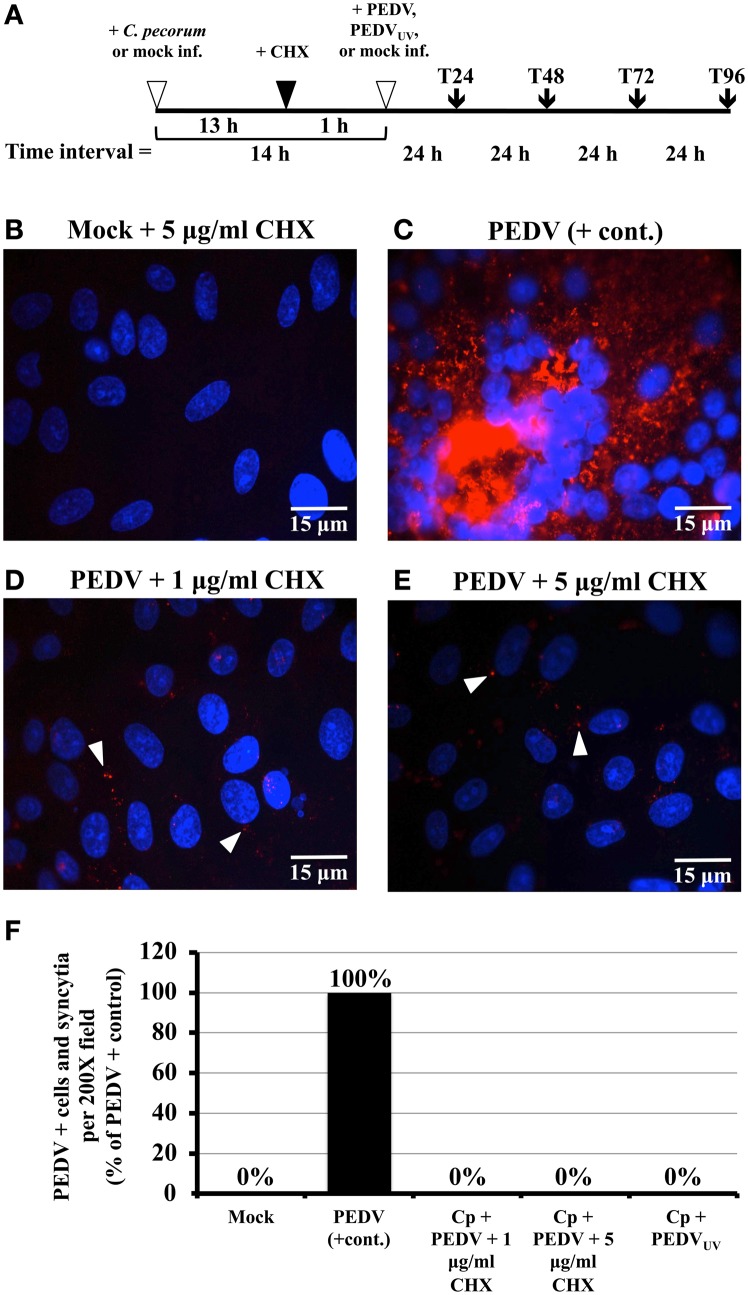
Figure 1.
Exposure to cycloheximide (CHX) and UV inactivation inhibits PEDV replication in Vero cells. (A) Simplified diagram of the co-infection procedure. At the start of each experiment, replicate Vero cell cultures on coverslips were either mock- or C. pecorum-infected. Fourteen hours later, they were mock-, PEDV- or PEDVUV-infected, as appropriate. In some experiments, cells were CHX-exposed from 1 h prior to viral infection to the end of the experiment. Regardless, all cells were refed with fresh growth medium (+ or − CHX as appropriate) after PEDV infection (T0). Samples were harvested for various analyses at 24 (T24), 48 (T48), 72 (T72) or 96 (T96) hpvi. (B–E) Vero cells were pre-exposed to either 1 μg/ml CHX or 5 μg/ml CHX, as indicated. One hour later, cultures were either PEDV-infected (PEDV) or mock-infected (Mock). Cultures were incubated for 48 hpvi, fixed, and immunolabeled with anti-PEDV M (red) and DAPI (blue). Representative fields at 1000× magnification are shown with 15 μm scale bars. White arrows indicate anti-PEDV M punctate staining, as discussed in the text. (F) Vero cells were mock-infected (Mock), mono-infected with PEDV (PEDV + cont.), infected with C. pecorum and PEDV (Cp + PEDV), or infected with C. pecorum and PEDVUV (Cp + PEDVUV) as in (A). In some cases, the cells were pre-exposed to 1 μg/ml CHX or 5 μg/ml CHX, as indicated. At 24 hpvi, cells were fixed, and labeled with anti-PEDV M (red) and DAPI (blue). Twenty random 200× magnification fields were examined on each coverslip; PEDV M protein positive single cells and syncytia were counted for each field, added together, and the average total number/field calculated. The PEDV positive control was set at 100% and the average counts obtained for the other samples were used to calculate % of the positive control. The % positive control values obtained were then plotted on the Y-axis; sample identity is shown below the X-axis.

