Figure 4.
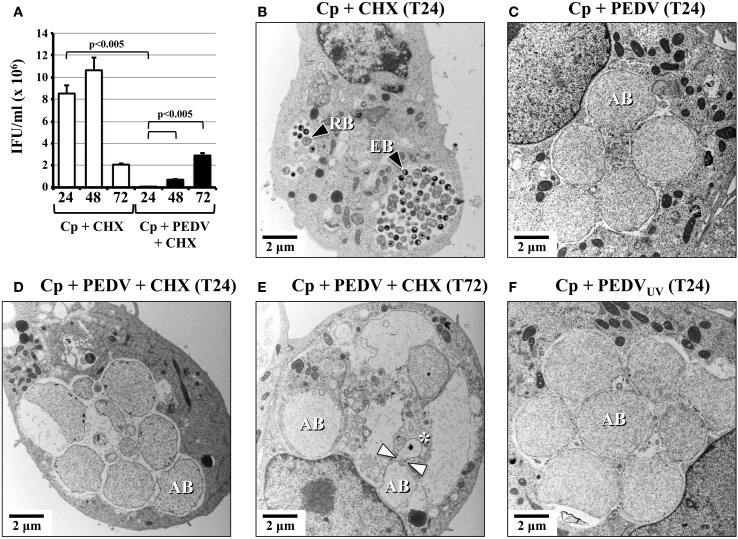
The PEDV-induced developmental cycle disruption is reversible. (A) Vero cells were mock-infected (Mock; data not shown), mono-infected with C. pecorum (Cp), or co-infected with C. pecorum and PEDV (Cp + PEDV) as diagrammed in Figure 1A. Cultures (+CHX) were pre-exposed to 5 μg/ml CHX starting at 1 h before viral infection to prevent PEDV replication, as described in Figure 1A. At 24 hpvi (T24), 48 hpvi (T48), and 72 hpvi (T72), replicate coverslips were used for sub-passage titer analysis. Inclusion counts were used to calculate inclusion forming units (IFU)/mL (Y-axis). The time hpvi and sample are shown below the X-axis. The average from three biologic replicates ± s.e.m. is shown; these data are representative of three independent experiments. Statistical comparisons are indicated by brackets and all were significant to p <0.005. (B–F) Vero cells were mock-infected (Mock; not shown), infected with C. pecorum (Cp), infected with C. pecorum and PEDV (Cp + PEDV), or infected with C. pecorum and PEDVUV (Cp + PEDVUV), as shown in Figure 1A. Some cultures (+CHX) were pre-exposed to 5 μg/ml CHX starting at 1 h before viral infection. At 24 hpvi (T24) and 72 hpvi (T72), replicate coverslips were fixed and processed for transmission electron microscopy. Representative photomicrographs at 7000× magnification are shown, scale bars are 2 μm. RB (RB-black arrow), EB (EB-black arrow), and AB are indicated. A white asterisk and double white arrows indicate a small AB with a condensed nucleoid that may be “budding” from an adjacent AB (E).

