
Figure 9.
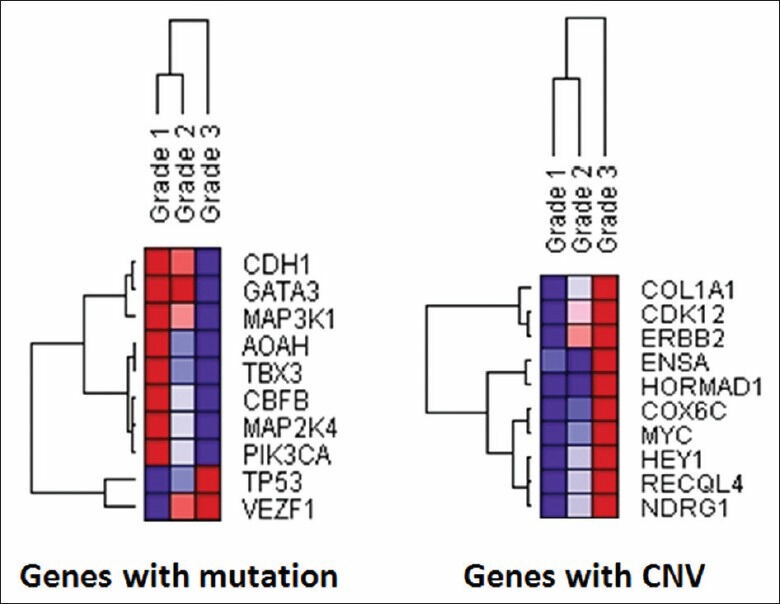
Unsupervised hierarchical clustering of the genes with the most significant genetic changes in relation to histologic grades. An unsupervised hierarchical clustering analysis was performed for the top 10 genes with the most significant mutation count (left) and copy number variance (right) in relation to invasive ductal carcinoma histologic grades using the Gene Pattern software (Broad Institute, Boston, MA) and its default parameters of average linkage and Pearson's correlation. Purple and red colors represent the lowest and highest incidence, respectively, for the genetic changes identified