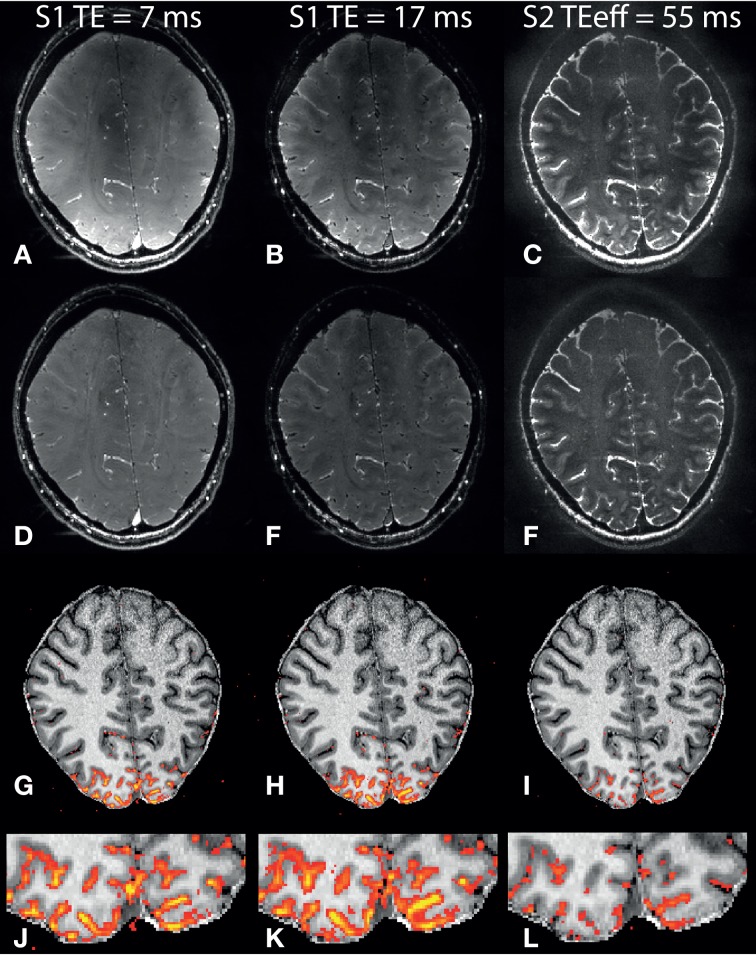
Figure 2.
Example nb-SSFP images and activation maps. Mean resting state images from one subject: (A) S1, TE = 7 ms, (B) S1, TE = 17 ms, (C) S2. (D–F): Same as (A–C) after bias field correction. (G–I): Anatomical image (MP2RAGE) overlaid with thresholded t-score maps for the first S1 (G), second S1 (H) and S2 (I) echoes. (J–L): Zoomed view of the same thresholded t-score maps. Color range for t-values is 2.3–10, and t-value images were smoothed using a gaussian kernel with SD = 0.65 voxels.

