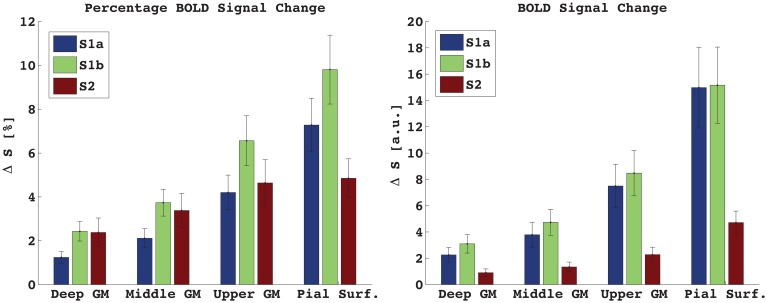
Figure 3.
Percentage (left) and absolute (right) signal change in GM and at the pial surface. S1a, TE = 7 ms, S1b, TE = 17 ms. Mean ± s.e.m., n = 7. Due to low GM-CSF contrast in S1, the absolute and percentage signal change looks very similar. In S2, where CSF is much brighter than GM, the percentage signal change is less different between bins than for the absolute signal change.

