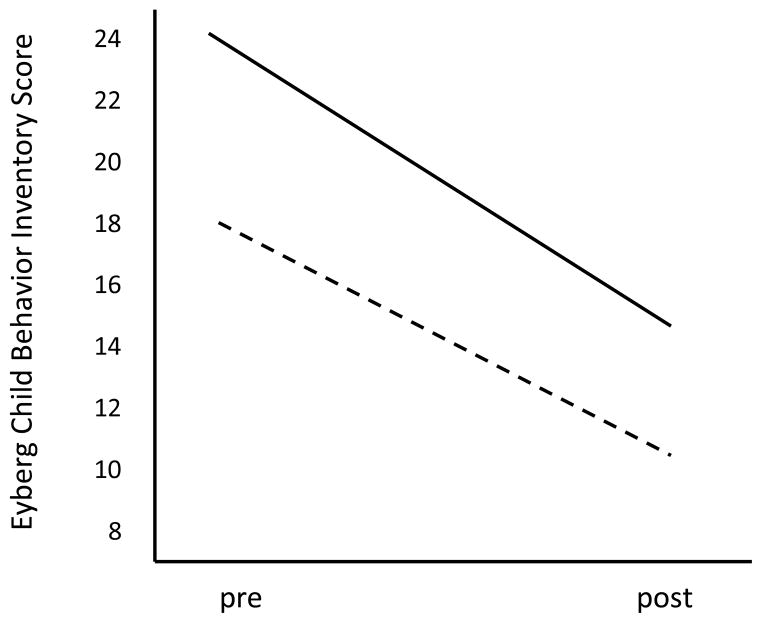
Figure 1.
Eyberg Child Behavior Inventory scores at pre- to post-treatment for children who scored > 1.0 SD below the sample mean on PEP reactivity (solid line) and for children who scored > 1.0 SD above the sample median on PEP reactivity (dashed line). Although both groups improved, individual differences in problem behavior were maintained.

