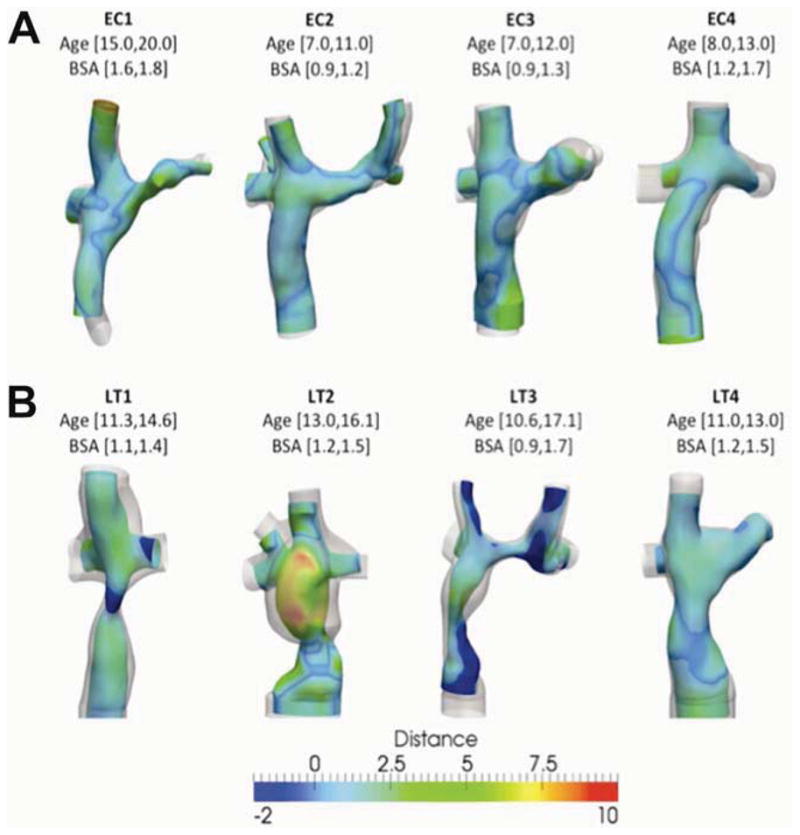
Figure 7.

Distance (in mm) between the geometry at the initial time point (color coded) and the latter time (translucent gray). Top row shows extra-cardiac patients (EC1 through EC4); bottom row shows Lateral Tunnel patients (LT1-LT4). Patient’s age and body surface area (BSA) for each time point of the study is indicated
