
Figure 4.
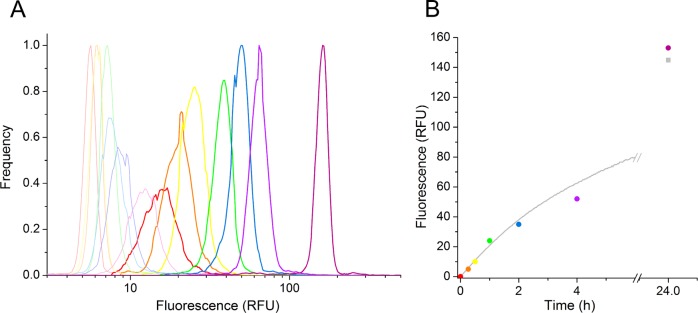
Introduction of time control by stopping the reaction at different time points. Diluted PAS-containing cell lysate was mixed with substrate on a microfluidic chip (Figure 2B) upon droplet formation. (A) FACS analysis of droplets with inactivated cell lysate. Heat inactivation was performed immediately after collection (t = 0, red), after 15 min (orange), 30 min (yellow), 1 h (green), 2 h (blue), 4 h (light violet), and 24 h (dark violet; end point measurement). The fluorescence distribution diagrams of heat-inactivated enzymatic reaction in droplets (left), measured 30 h after the reaction was started, show the background control droplets (with substrate only) in pale and droplets containing cell lysate in dark colors. (B) Overlay of normalized relative fluorescence versus time data obtained from FACS analysis (colored points corresponding to peaks in (A) and kinetics measurement in 96-well format (gray curve).