
Figure 1.
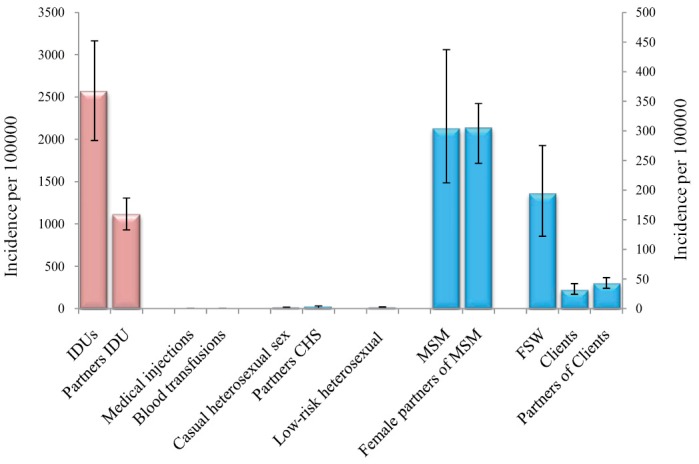
New HIV infections in key populations at highest risk per 100,000 (with 95% CI); the error bars represent the 95% simulation intervals. The incidence in all groups appears on the right hand side of the figure excluding PWID and their sexual partners. Reprinted with permission from Nasirian et al. (5)