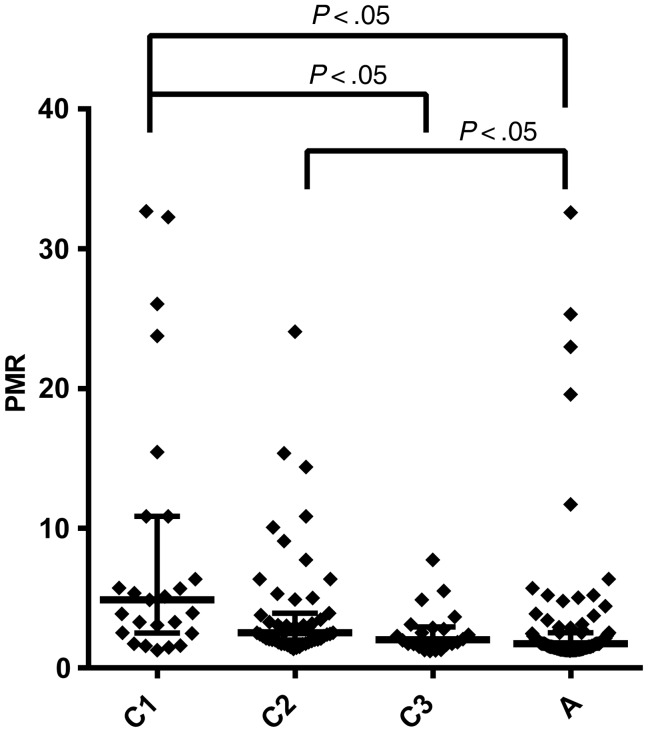
Figure 4.
Reduced parasite growth rate with age. The estimated parasite growth rates for individuals in the different age groups are indicated. Median growth rates and interquartile range are indicated. Horizontal bars above indicate groups that are significantly different (P < .05, Kruskal–Wallis test). Abbreviations: A, adults; C1, C2, C3, children of increasing age; PMR, mean parasite multiplication rate.

