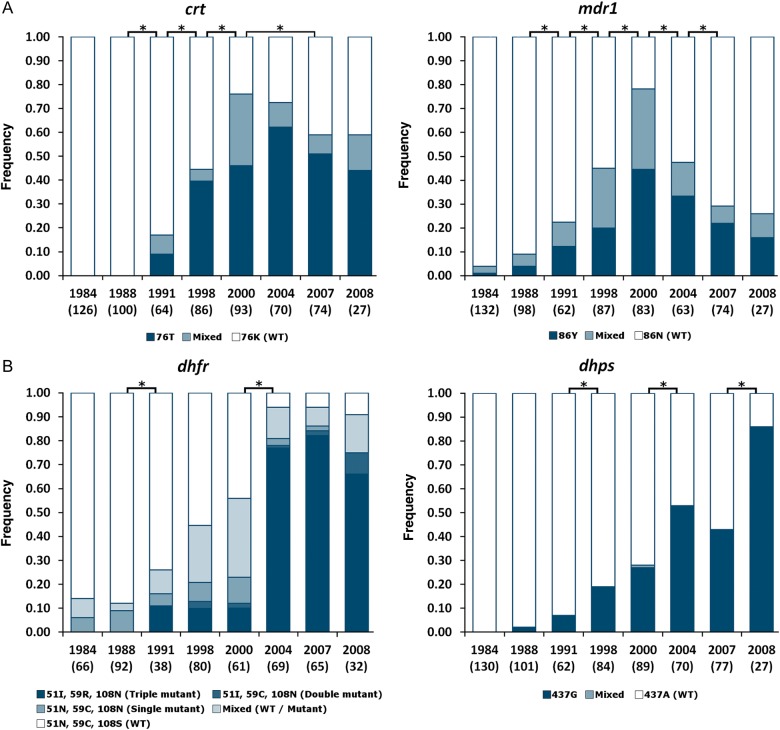
Figure 1.
Proportions of Plasmodium falciparum–infected individuals with each allele at 4 drug resistance loci in 8 surveys conducted in the Farafenni area of The Gambia between 1984 and 2008. A, Chloroquine resistance loci (crt and mdr1). B, Antifolate resistance loci (dhfr and dhps). The numbers of individual infections genotyped for each locus in each year are shown in brackets under each plot. Asterisk indicates significant change (P < .05) in the proportions of isolates with each allele between bracketed years (for dhfr, the proportion of samples with resistance type at each of the triple positions dhfr-51I-59C-108N was compared between years). Abbreviation: WT, wild type.

