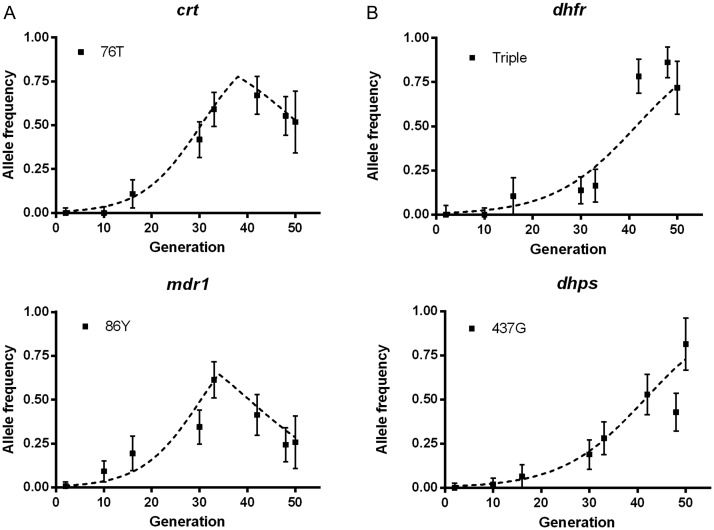
Figure 2.
Models of selection at 4 Plasmodium falciparum drug resistance loci related to allele frequency changes between 1984 and 2008. Allele frequencies (with 95% confidence intervals) of the resistance alleles of (A) chloroquine resistance genes crt and mdr1 and (B) antifolate resistance genes dhfr and dhfr are plotted on a time scale, assuming 2 parasite life-cycle generations per year (50 generations from 1984 to 2008). The timing and relative strength of selection at each of the 4 loci was modeled with the following parameters: (A) Chloroquine resistance loci: for crt 76T positive drug selection coefficient s = 0.15 until generation 39 (in 2003) and s = −0.1 thereafter; for mdr1 86Y positive selection s = 0.13 until generation 39 and s = −0.15 thereafter. B, Pyrimethamine and sulfadoxine antifolate resistance loci: for dhfr triple mutant allele positive selection s = 0.11, and for dhps 437G positive selection s = 0.11, throughout the period.

