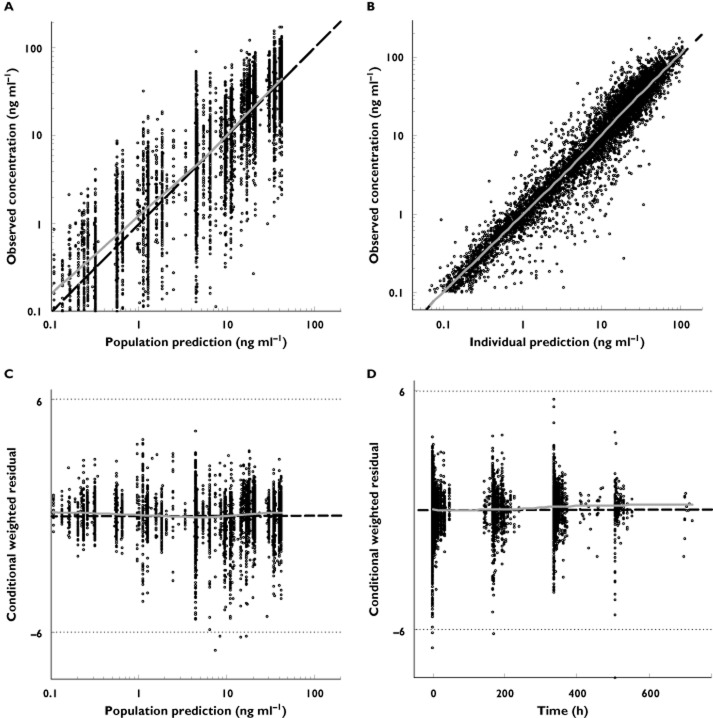
Figure 1.
Diagnostic plots for the base model: (A) observed vs. population predicted concentrations; (B) observed vs. individual predicted concentrations; (C) conditional weighted residuals vs. population predicted concentrations; (D) conditional weighted residuals vs. time. Dashed lines represent lines of identity (A,B) or null value (C,D) and solid lines depict smooth (LOESS) trends. LOESS, locally weighted scatter plot smoothing

