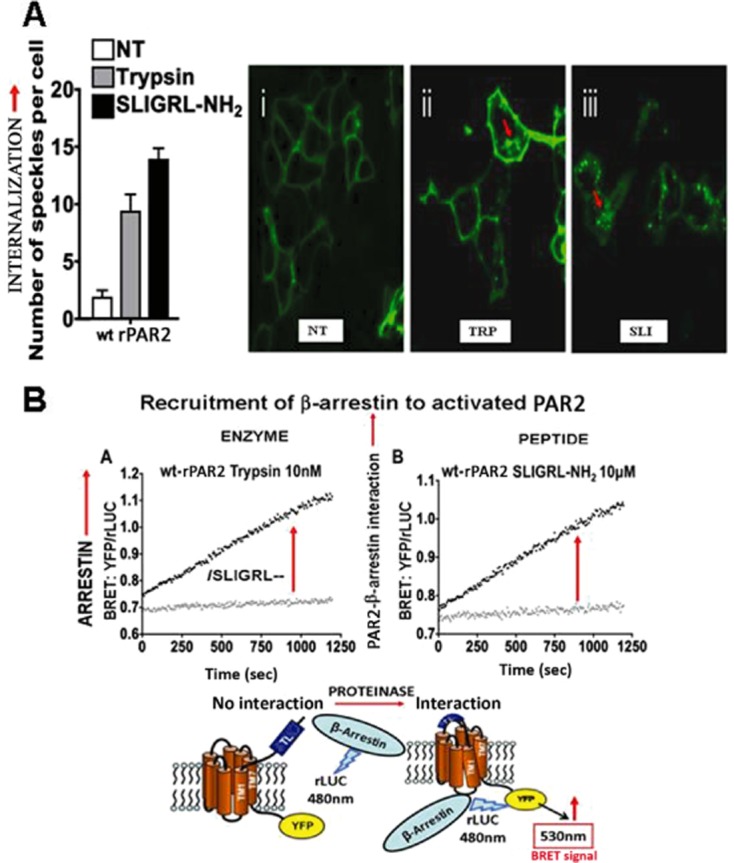
Figure 4.

Monitoring PAR2 internalization and arrestin interaction upon activation. (A) PAR2 internalization (red arrows) after activation by either trypsin (TRP: middle micrograph) or PAR2-activating peptide (SLI: right-hand micrograph). Receptor in the untreated cells (NT) is membrane delimited. Internalization is quantified (left histograms) by morphometric analysis of internalized receptor clusters (green dots, red arrows, micrographs on the right, panel A). (B) Monitoring PAR2-β-arrestin interaction by BRET after activation by the TL revealed by trypsin (left) or by a synthetic PAR-activating peptide (right). PAR2-β-arrestin interactions stimulated by either trypsin (B, panel A) or PAR2-activating peptide (B, panel B) are quantified by measuring the yelllow fluorescent protein (YFP) emission at 540 nm relative to the rLUC signal (YFP/rLUC), caused by BRET (panel B), as shown by the diagram at the bottom of B. Adapted from Ramachandran et al., 2009, with permission.
