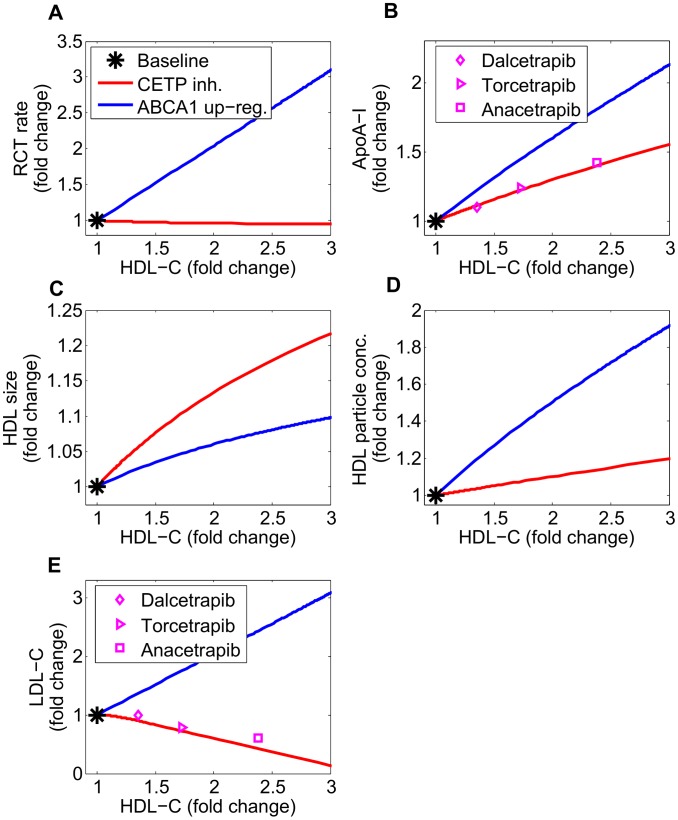
Figure 13. Comparison of CETP inhibition with ABCA1 up-regulation: changes in RCT rate (panel A) and biomarkers (ApoA-I, panel B; HDL size, panel C; HDL particle concentration, panel D; LDL-C, panel E) versus the rise in HDL-C.
The nominal subject is taken as the baseline. The model simulation of CETP inhibition is compared with literature data of CETP inhibitors, Dalcetrapib [50], Torcetrapib [51] and Anacetrapib [52].

