
FIGURE 1:
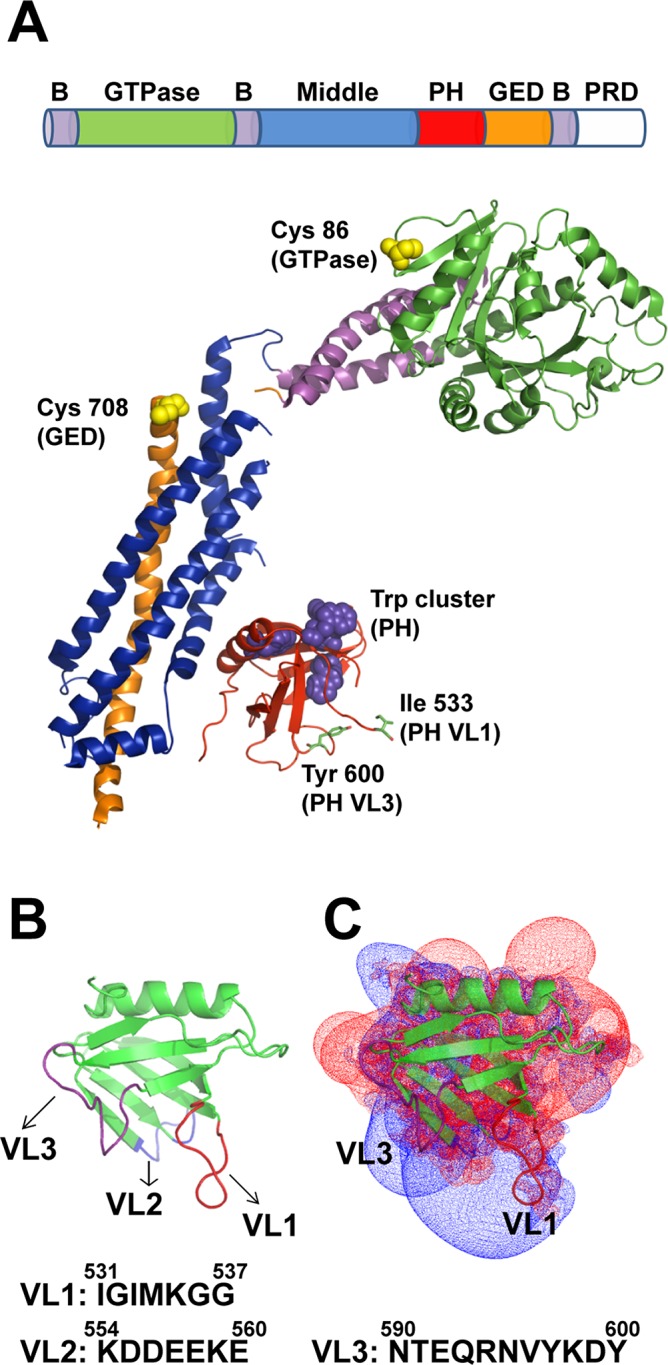
Dynamin structure and structural elements. (A) Domain arrangement in the primary structure of dynamin and color-coded ribbon representation of the Dyn1ΔPRD crystal structure (Faelber et al., 2011; Protein Data Bank [PDB] ID 3SNH). Residues Ile-533 in VL1 and Tyr-600 in VL3 are shown in stick representations. Trp residues located in the PH domain (magenta) and solvent-exposed Cys-708 (GED) and Cys-86 (GTPase) residues fluorescently labeled in this study (yellow) are shown in space-filled representations. B, constituent helices of the three-helix bundle signaling element (BSE); GED, GTPase effector domain; PH, pleckstrin homology domain; PRD, proline-rich domain. (B) Ribbon representation of Dyn1PH (PDB ID 1DYN) with the variable loops (VL1–3) highlighted in color. Membrane-proximal amino acid residue sequences in VL1–3 are shown underneath. (C) Electrostatic potential map of Dyn1PH in the same orientation as in B contoured at −1.5kT (red; negative) and +1.5kT (blue; positive) as originally shown in Ferguson et al. (1994) and Lemmon and Ferguson (2000). Inset, ribbon representation of the Dyn1PH backbone. Calculations using GRASP in Swiss-PdbViewer.