
FIGURE 7:
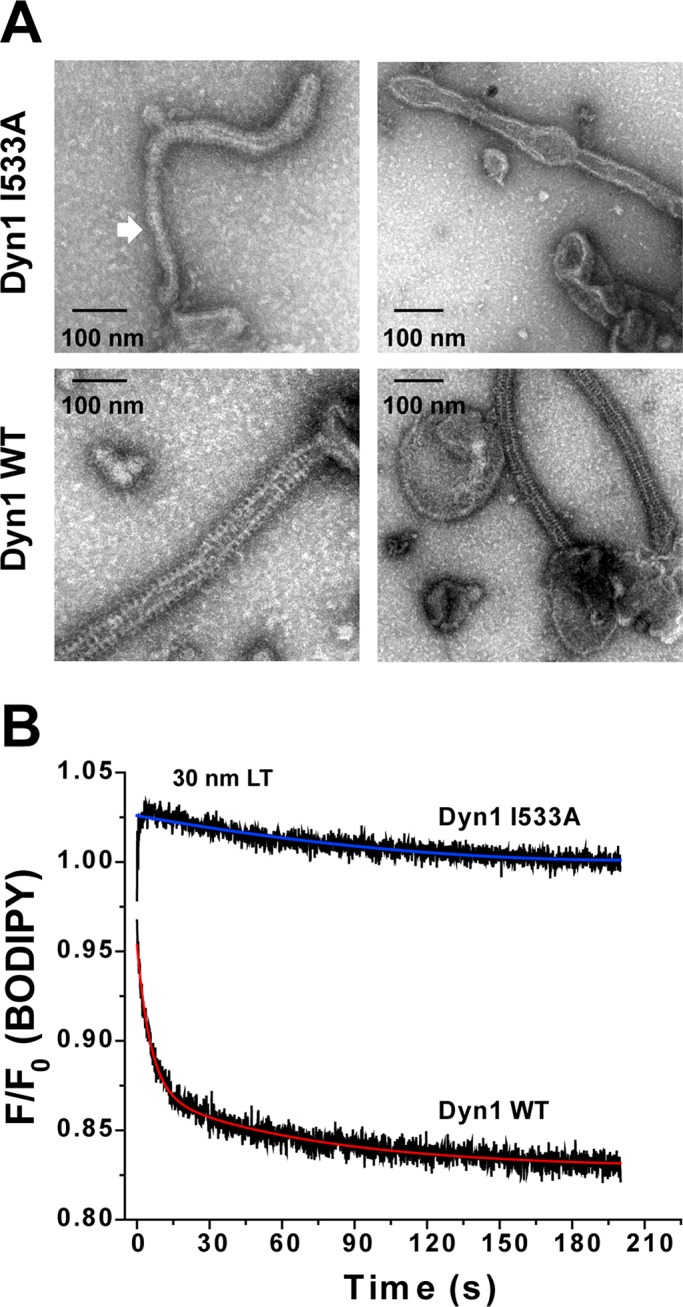
Alternate PH-domain orientations affect dynamin polymer morphology. (A) Representative EM images of Dyn1 WT and Dyn1 I533A self-assembled on 400-nm-diameter PIP2-containing liposomes. Block arrow points to a highly constricted polymer conformation sampled by Dyn1 I533A relative to the uniform curvature of Dyn1 WT. (B) BODIPY emission intensity change at 510 nm (λex = 490 nm) upon self-assembly of BODIPY-Dyn1 WT or -Dyn1 I533A (0.1 μM) on unlabeled LT (5 μM total lipid; 10 mol% PIP2) was monitored by stopped-flow kinetics. F0 is the emission intensity at time 0 before LT addition and F is the intensity at time t. Representative kinetic traces are shown. Kinetic traces were best fitted (colored traces) to a biexponential kinetic equation (Materials and Methods).