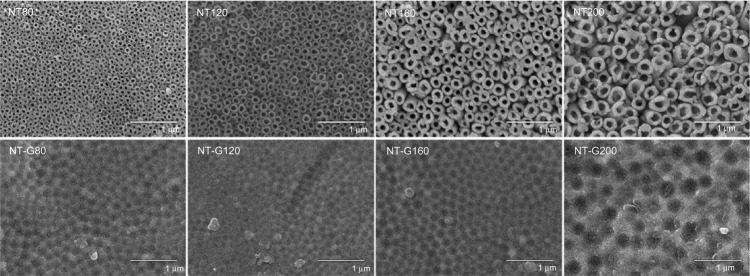
Figure 1.

Morphological characterization of different diameter nanotubular surfaces using scanning electron microscopy (first row) and drug-loaded nanotubular surfaces (second row).
Notes: The scanning electron microscopy images show that the tube diameters were 80, 120, 160, and 200 nm, respectively. The surfaces of the drug-loaded nanotubes retain the nanotubular structure. The magnification level is ×30,000. The scale bar is 1 μm.
Abbreviations: NT, nanotubes; NT-G, gentamicin-loaded nanotubes.
