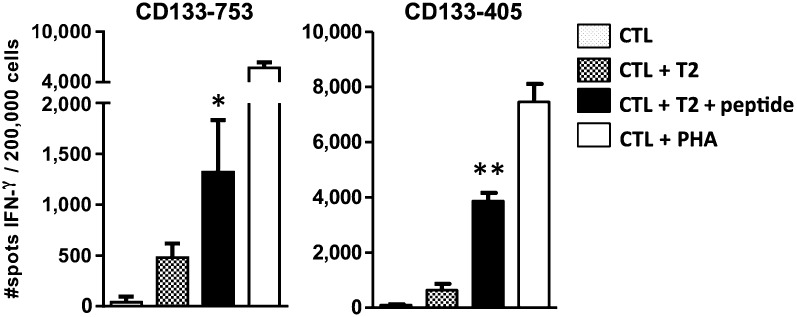
Figure 1.
In vitro immunogenicity of CD133-405 and CD133-753 peptides evaluated by IFN-γ Elispot. Wells from CD133-753 and CD133-405 CTL cultures showing IFN-γ production were pooled and seeded (5,000 cells per well) with T2 cells (100,000 cells per well) in the presence or absence of the indicated peptide. Results show the number of spots (IFN-γ producing cells) as determined by Elispot. Error bars represent the standard deviation of triplicate wells. Significant differences between peptide stimulated cultures (CTL + T2 + peptide) and control wells (CTL + T2) are indicated as follows: ∗, p = .02; ∗∗, p < .0001. Abbreviations: CTL, cytotoxic T cell; IFN-γ, interferon-γ.

