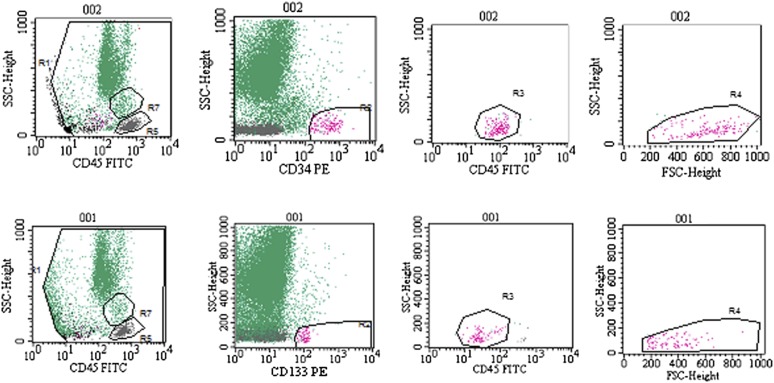
Figure 2.
Fluorescence-activated cell sorting analysis of CD34+ (top) and CD133+ (bottom) cell content in the bone marrow nucleated cells. Representative plots demonstrate the identification and quantification of the subpopulations. Top row: CD34+ cell population: debris exclusion, high CD34 and low CD45 expression, low granularity and lymphocyte size. Bottom row: CD133+ cell population: debris exclusion, CD133 expression, low CD45 expression, low granularity and lymphocyte size. Abbreviations: FITC, fluorescein isothiocyanate; FSC, forward scatter; PE, phycoerythrin; SSC, side scatter.

