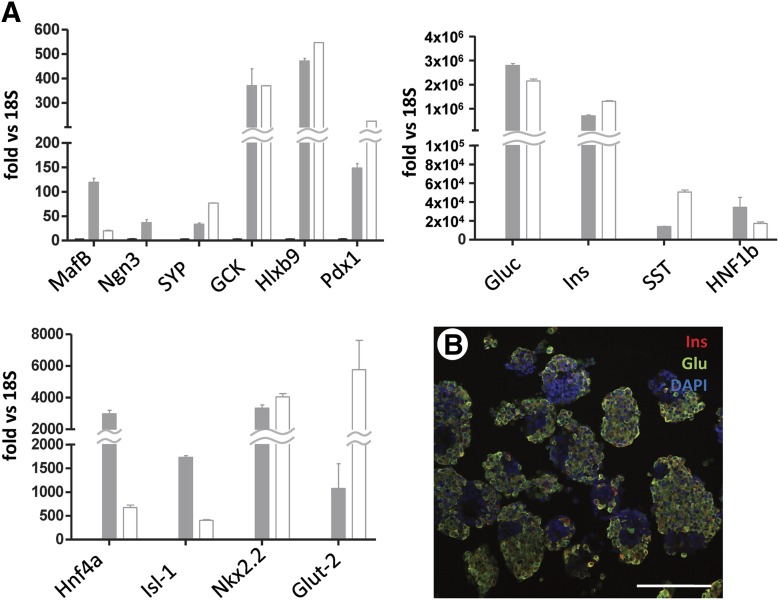
Figure 1.
Gene expression and immunofluorescence profile of stage 6 cells. (A): Quantitative real-time reverse transcription-polymerase chain reaction of 14 representative markers of pancreatic endocrine cell differentiation. Open columns indicate human isolated islets (positive control). Gray columns indicate stage 6 human embryonic stem cell-derived endocrine-like cells. Bars indicate SE. The y-axis indicates fold increase over 18S (endogenous normalizer). (B): Immunofluorescence staining of insulin (red) and glucagon (green). Scale bar = 150 μm. Abbreviations: DAPI, 4′,6-diamidino-2-phenylindole; Glu, glucagon; Ins, insulin.

