
Figure 6. Histology.
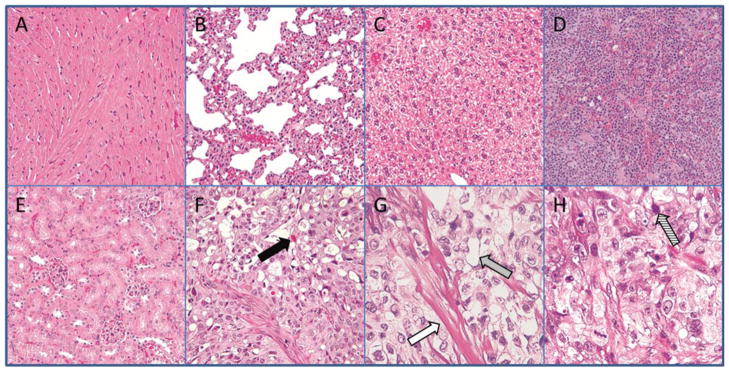
Representative samples removed at the end of the 40 day study and stained using H&E staining. Organs showed no difference compared to controls. Arrows represent potential types of evidence for radiation related effects from 90Y-HPMA copolymer-DOTA and hyperthermia treatment.
A) Heart (magnification 40×)
B) Lung (40×)
C) Liver (40×)
D) Spleen (40×)
E) Kidney (40×)
F) Radiotherapy treated tumor (40×)
G) Radiotherapy treated tumor (100×)
H) Radiotherapy treated tumor (100×)
Solid black arrow = thanatosome infiltration
White arrow = Fibrosis
Grey arrow = Vacuole formation
Striped arrow = Apoptotic bodies