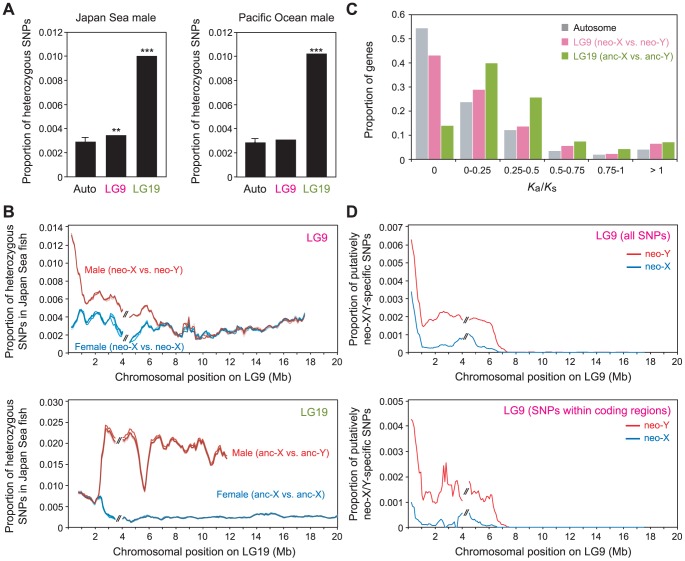
Figure 3. Nucleotide divergence between the Japan Sea neo-X and the neo-Y chromosomes.
(A) Proportion of heterozygous SNPs in the Japan Sea male (left panel) and the Pacific Ocean male (right panel). A Grubbs' outlier test was conducted to test whether LG9 and LG19 are outliers of all other linkage groups: **, P<0.01, ***, P<0.001. Data from one representative male of each species are shown here. For autosomes, means ± S.E. are shown. (B) Sliding window analysis of the proportion of heterozygous SNPs in the Japan Sea male (red) and the Japan Sea female (blue) for LG9 (neo-sex chromosomes; upper panel) and LG19 (ancestral-sex chromosomes [anc-X and anc-Y]; lower panel). The window size and the step size were 500 kb and 100 kb, respectively. The two largest supercontigs were analyzed here, and the right one was inverted to provide the correct orientation as in Figure 2. The gap between these two supercontigs is indicated by // in the figure. Different colored lines indicate the five different Japan Sea males and the five different Japan Sea females. It should be noted that the scales on the Y-axis are different between the upper and lower panels. (C) Histogram of K a/K s between the Japan Sea neo-X and neo-Y chromosomes. (D) Sliding window analysis of proportion of putatively neo-X-specific (blue) and neo-Y-specific (red) SNPs among sequenced sites. The window size and the step size were 500 kb and 100 kb, respectively. The lower panel indicates only SNPs within coding regions.

