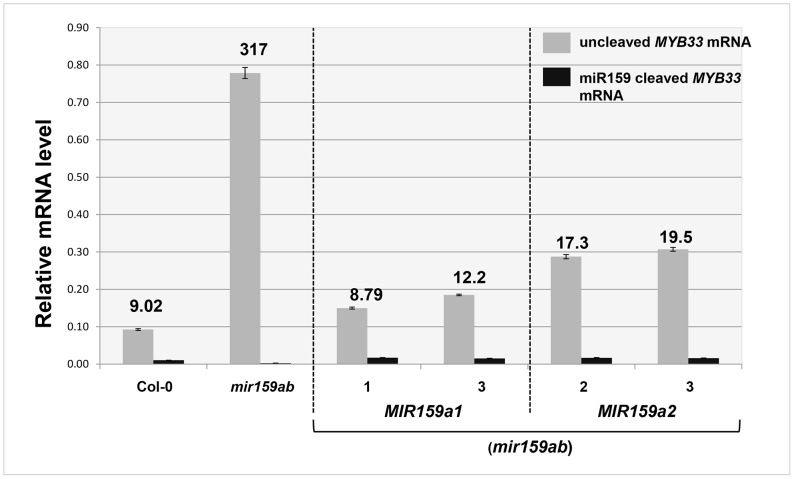
Figure 4. Quantitative comparison of un-cleaved MYB33 mRNA and miR159-guided 3′-end MYB33 cleavage products in MIR159a1 and MIR159a2 variants.
Grey bars represent the un-cleaved MYB33 transcript levels in Col-0, mir159ab, and independent transgenic lines of MIR159a1 (mir159ab) and MIR159a2 (mir159ab). Black bars represent the levels of miR159-guided 3′-end MYB33 cleavage products in the same lines. Numbers show the relative ratio of un-cleaved transcripts to cleavage products. All mRNA levels were normalized with CYCLOPHILIN 5. Measurements are the average of three technical replicates. Similar results were obtained with two independent biological replicates. Error bars represent the SEM.

