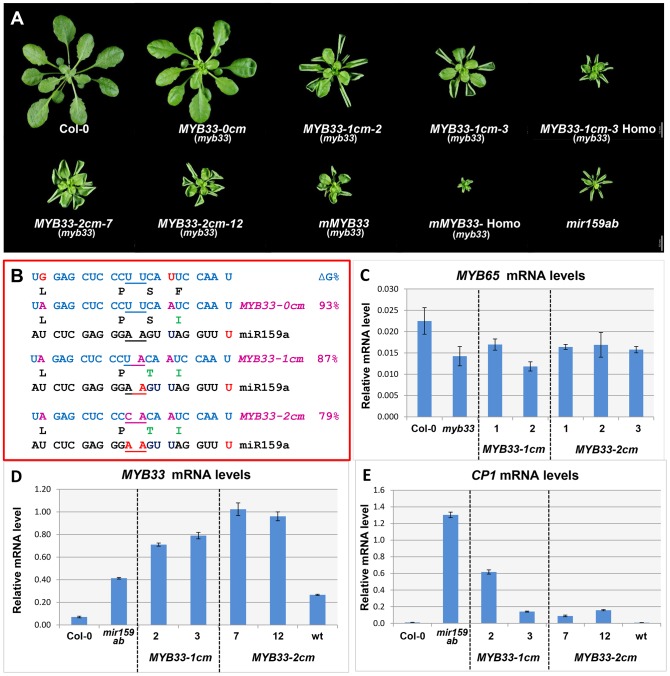
Figure 7. MYB33 variants with central mismatches are not fully silenced.
(A) Aerial view of rosettes from 35-day-old MYB33-1 cm and MYB33-2 cm plants (myb33 genotype) grown side by side with Col-0, mir159ab and mMYB33 under short day conditions. Homo stands for homozygous plants for the transgene. Scale bar = 10 mm. (B) The alignment between the different MYB33 variants and miR159a. The sequences of the amino acids encoded by the miR159 target site in different MYB33 transgenes are shown below. The percentage of free energy when pairing to miR159a compared to the perfect match is shown on the right. Red: mismatches; Purple: nucleotides mutated in the MYB33 miR159 target site. Amino acid changes compared to the original MYB33 protein are highlighted with green. (C) The steady state MYB65 mRNA level in the rosette of selected MYB33-1 cm and MYB33-2 cm transgenic lines with mutant phenotypes. Levels are not statistically different between the variants and parental myb33 plants (D) The steady-state MYB33 mRNA levels in rosettes of the transgenic lines shown in (A). (E) CP1 mRNA levels in the rosette of the transgenic lines shown in (A). All mRNA levels were normalized with CYCLOPHILIN 5. Measurements are the average of three technical replicates. Error bars represent the SEM.

