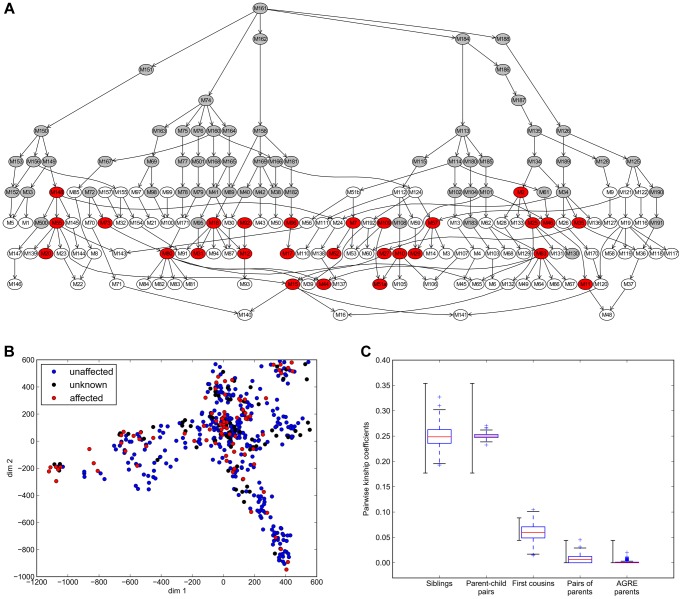
Figure 1. Amish pedigree sub-structure.
A) Nuclear family graph representation of the entire pedigree. Each node represents a nuclear family and families are connected by parent-child relationships. The pedigree includes families with genealogical information but without DNA available (grey), families with SNP genotype data available (white and red) and families with at least one WGS subject (red). B) Visualization by multidimensional scaling (MDS) of population substructure and distribution of affection status in the extended pedigree based on microsatellite genotypes. Individuals with Major Affective disorder (BPI or BPII) are shown in red, unaffected individuals in blue. Subjects with other mental illness are depicted as having unknown phenotype (black). C) Pair wise kinship coefficients for known family relationships in the Amish pedigree and an independent set of unrelated parents from the Autism Genetics Research Exchange (AGRE) [88]. As reported in _ENREF_34 [28], expected kinship coefficients are >0.354 for duplicate samples/monozygotic twins, [0.177–0.354] for 1st degree relatives, [0.0884–0.177] for 2nd degree relative, [0.0442–0.0884] for 3rd degree relatives and <0.0442 for unrelated subjects The expected range of kinship coefficients is shown to the left, the observed kinship coefficients to the right.

