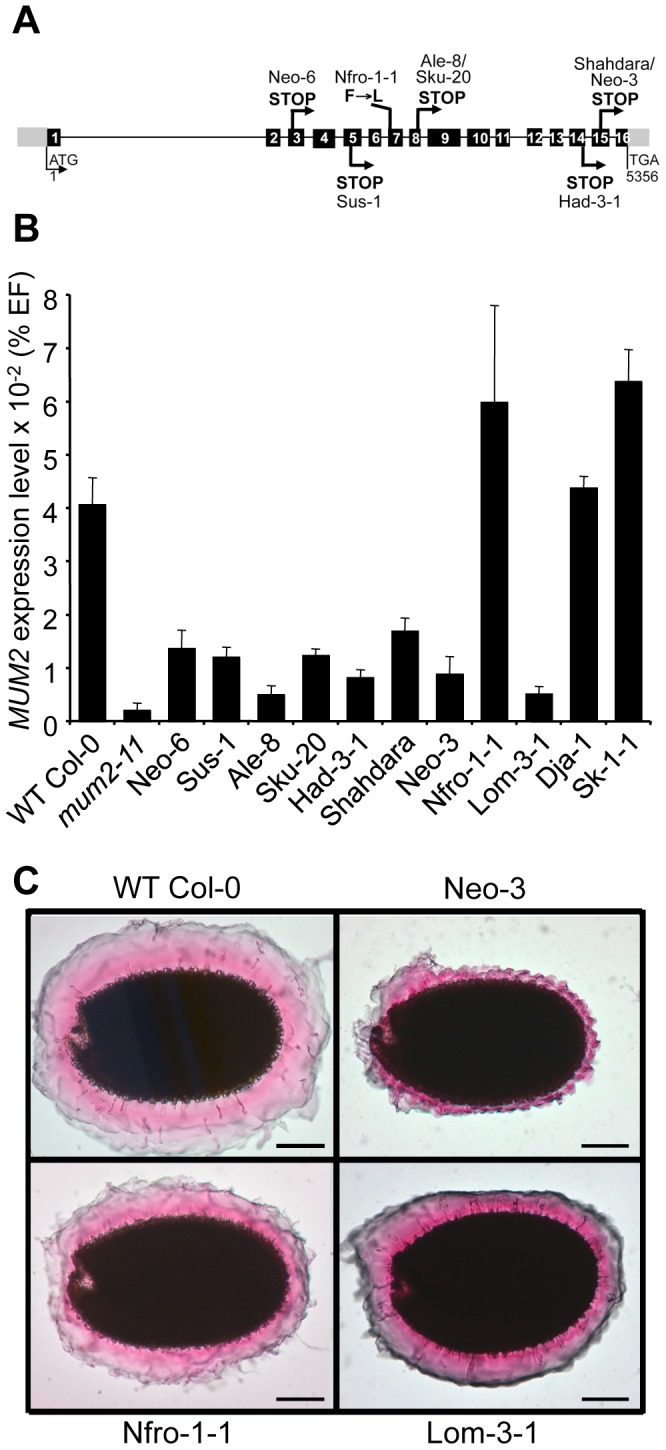
Figure 1. Characterization of natural mum2 mutants.

(A) Schematic representation of the MUM2 gene indicating the positions of the causal mutations in the different accessions and their effect on the encoded protein in capital letters. Boxes represent exons; black shading shows coding sequence; grey shading indicates 5′ and 3′ untranslated regions. (B) Steady state MUM2 mRNA levels in developing siliques of indicated accessions, 8–12 days after pollination, represented as a percentage of the constitutive EF1α-4a (EF) gene abundance. Error bars represent SE (n = 6). (C) Ruthenium red stained seeds of indicated accessions after forced mucilage release by sequential treatment with HCl and NaOH. WT, wild type.
