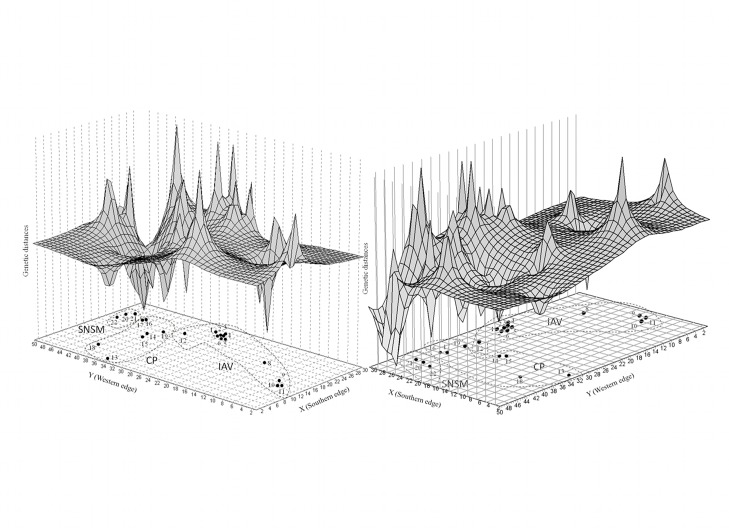
Figure 3. Landscape shape interpolation of genetic distances within T. dimidiata in geographical space in Colombia.
A graphical interpolation-based representation of the ND4 gene's genetic diversity was made using a 30×50 grid and a distance-weighting parameter of 1 for T. dimidiata in Colombia. The x- and y-axes represent geographical coordinates, while surface heights along the z-axis indicate genetic distance. Peaks and valleys are indicative of areas with high or low pairwise genetic distance between ND4 haplotypes, respectively. The position of sampling sites in the “base” of the graph is the approximate distribution of localities described in Table 1 and Figure 1.

