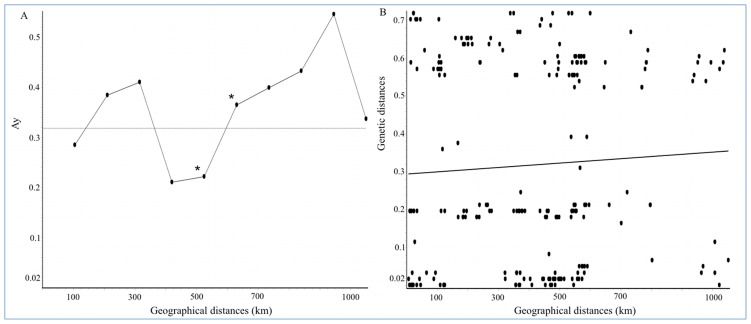
Figure 4. Distance-based analyses of population structure of T. dimidiata in Colombia.
A) Distogram of spatial autocorrelation analysis of T. dimidiata from Colombia showing the relationship between pairwise genetic ND4 gene distances (y-axis) and geographical distances (m) in 10 spatial classes (x-axis). Horizontal line indicates the average value of Ay for the data set. Asterisk represents a significant (p<0.05) Miller autocorrelation index (Ay). B) Mantel test of genetic (ND4 gene) and geographical distances (m) between the geographical locations of T. dimidiata analyzed in this study.

